Technology & Human Centric Design
GeoHealth - COVID Detection from Waste Water
Determining COVID risks using CDC wastewater data enables individuals to achieve a higher level of public health literacy, especially in light of reduced testing. Furthermore, we aim to empower health-conscious individuals to utilize location-specific health metrics to help prevent the spread of diseases. This application features a fully functional front end and back end with API/SQL database integration. Data is retrieved from the CDC API, and a smoothing algorithm calculates risk levels over time for each wastewater plant. This information is then matched with destination zip codes, enabling efficient data retrieval. It is hosted on Chip's Rocket Linux server.
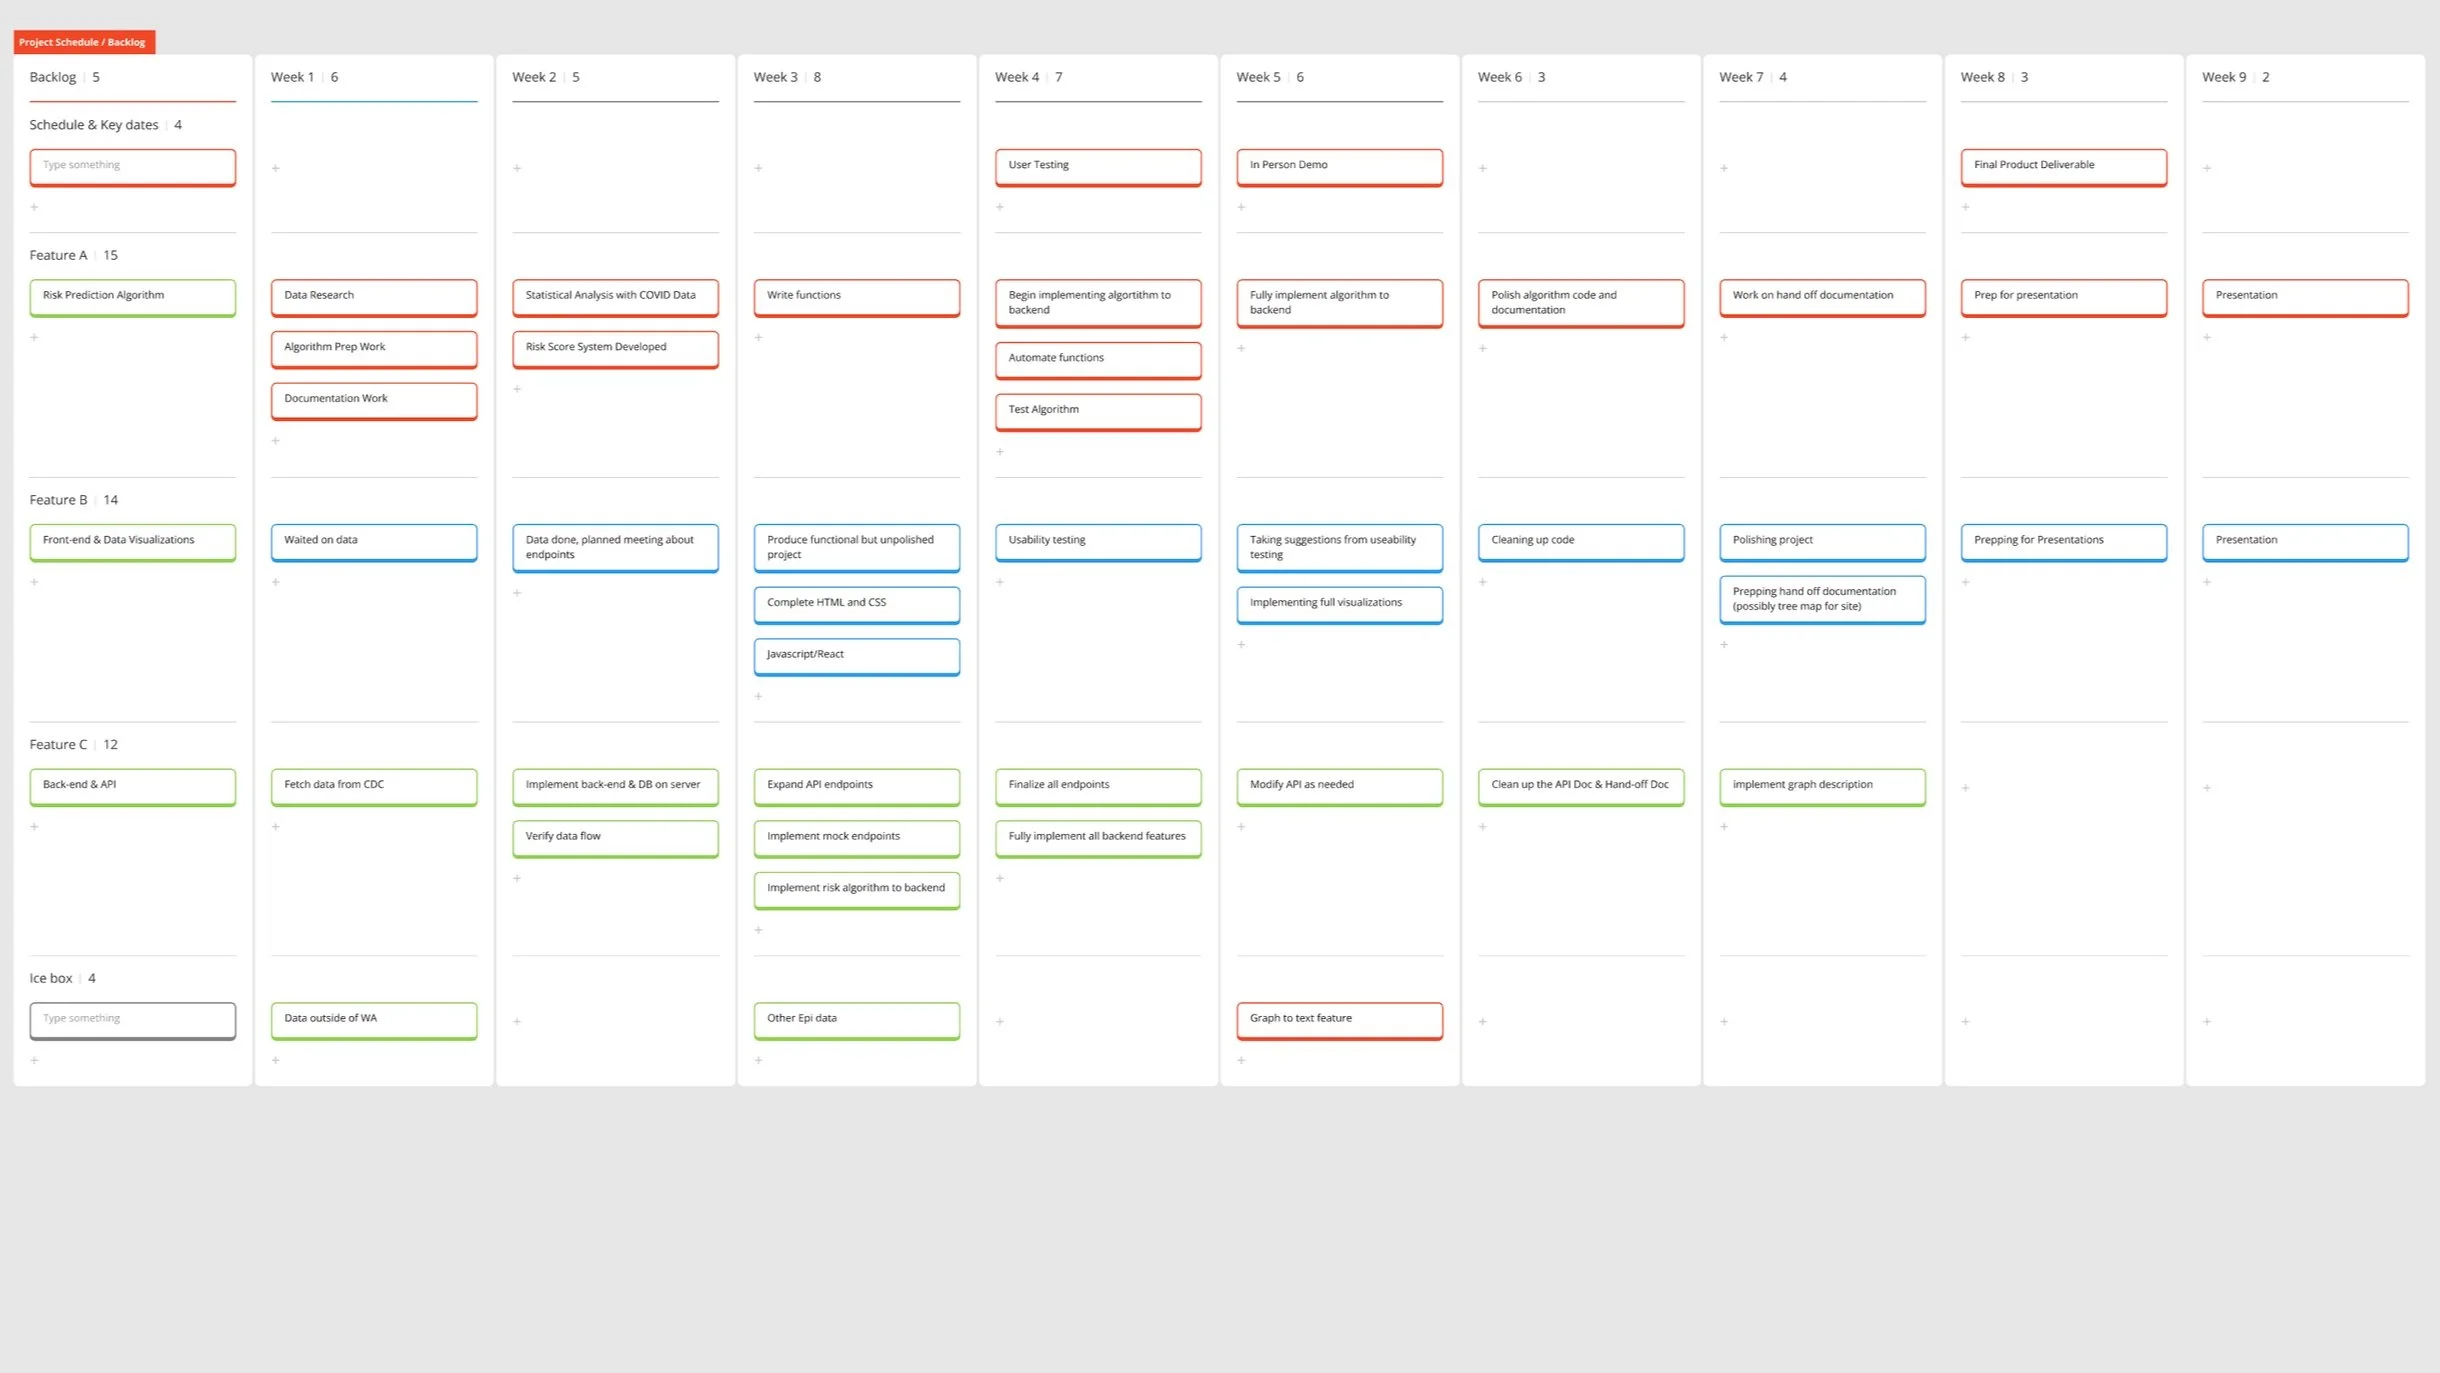
Development
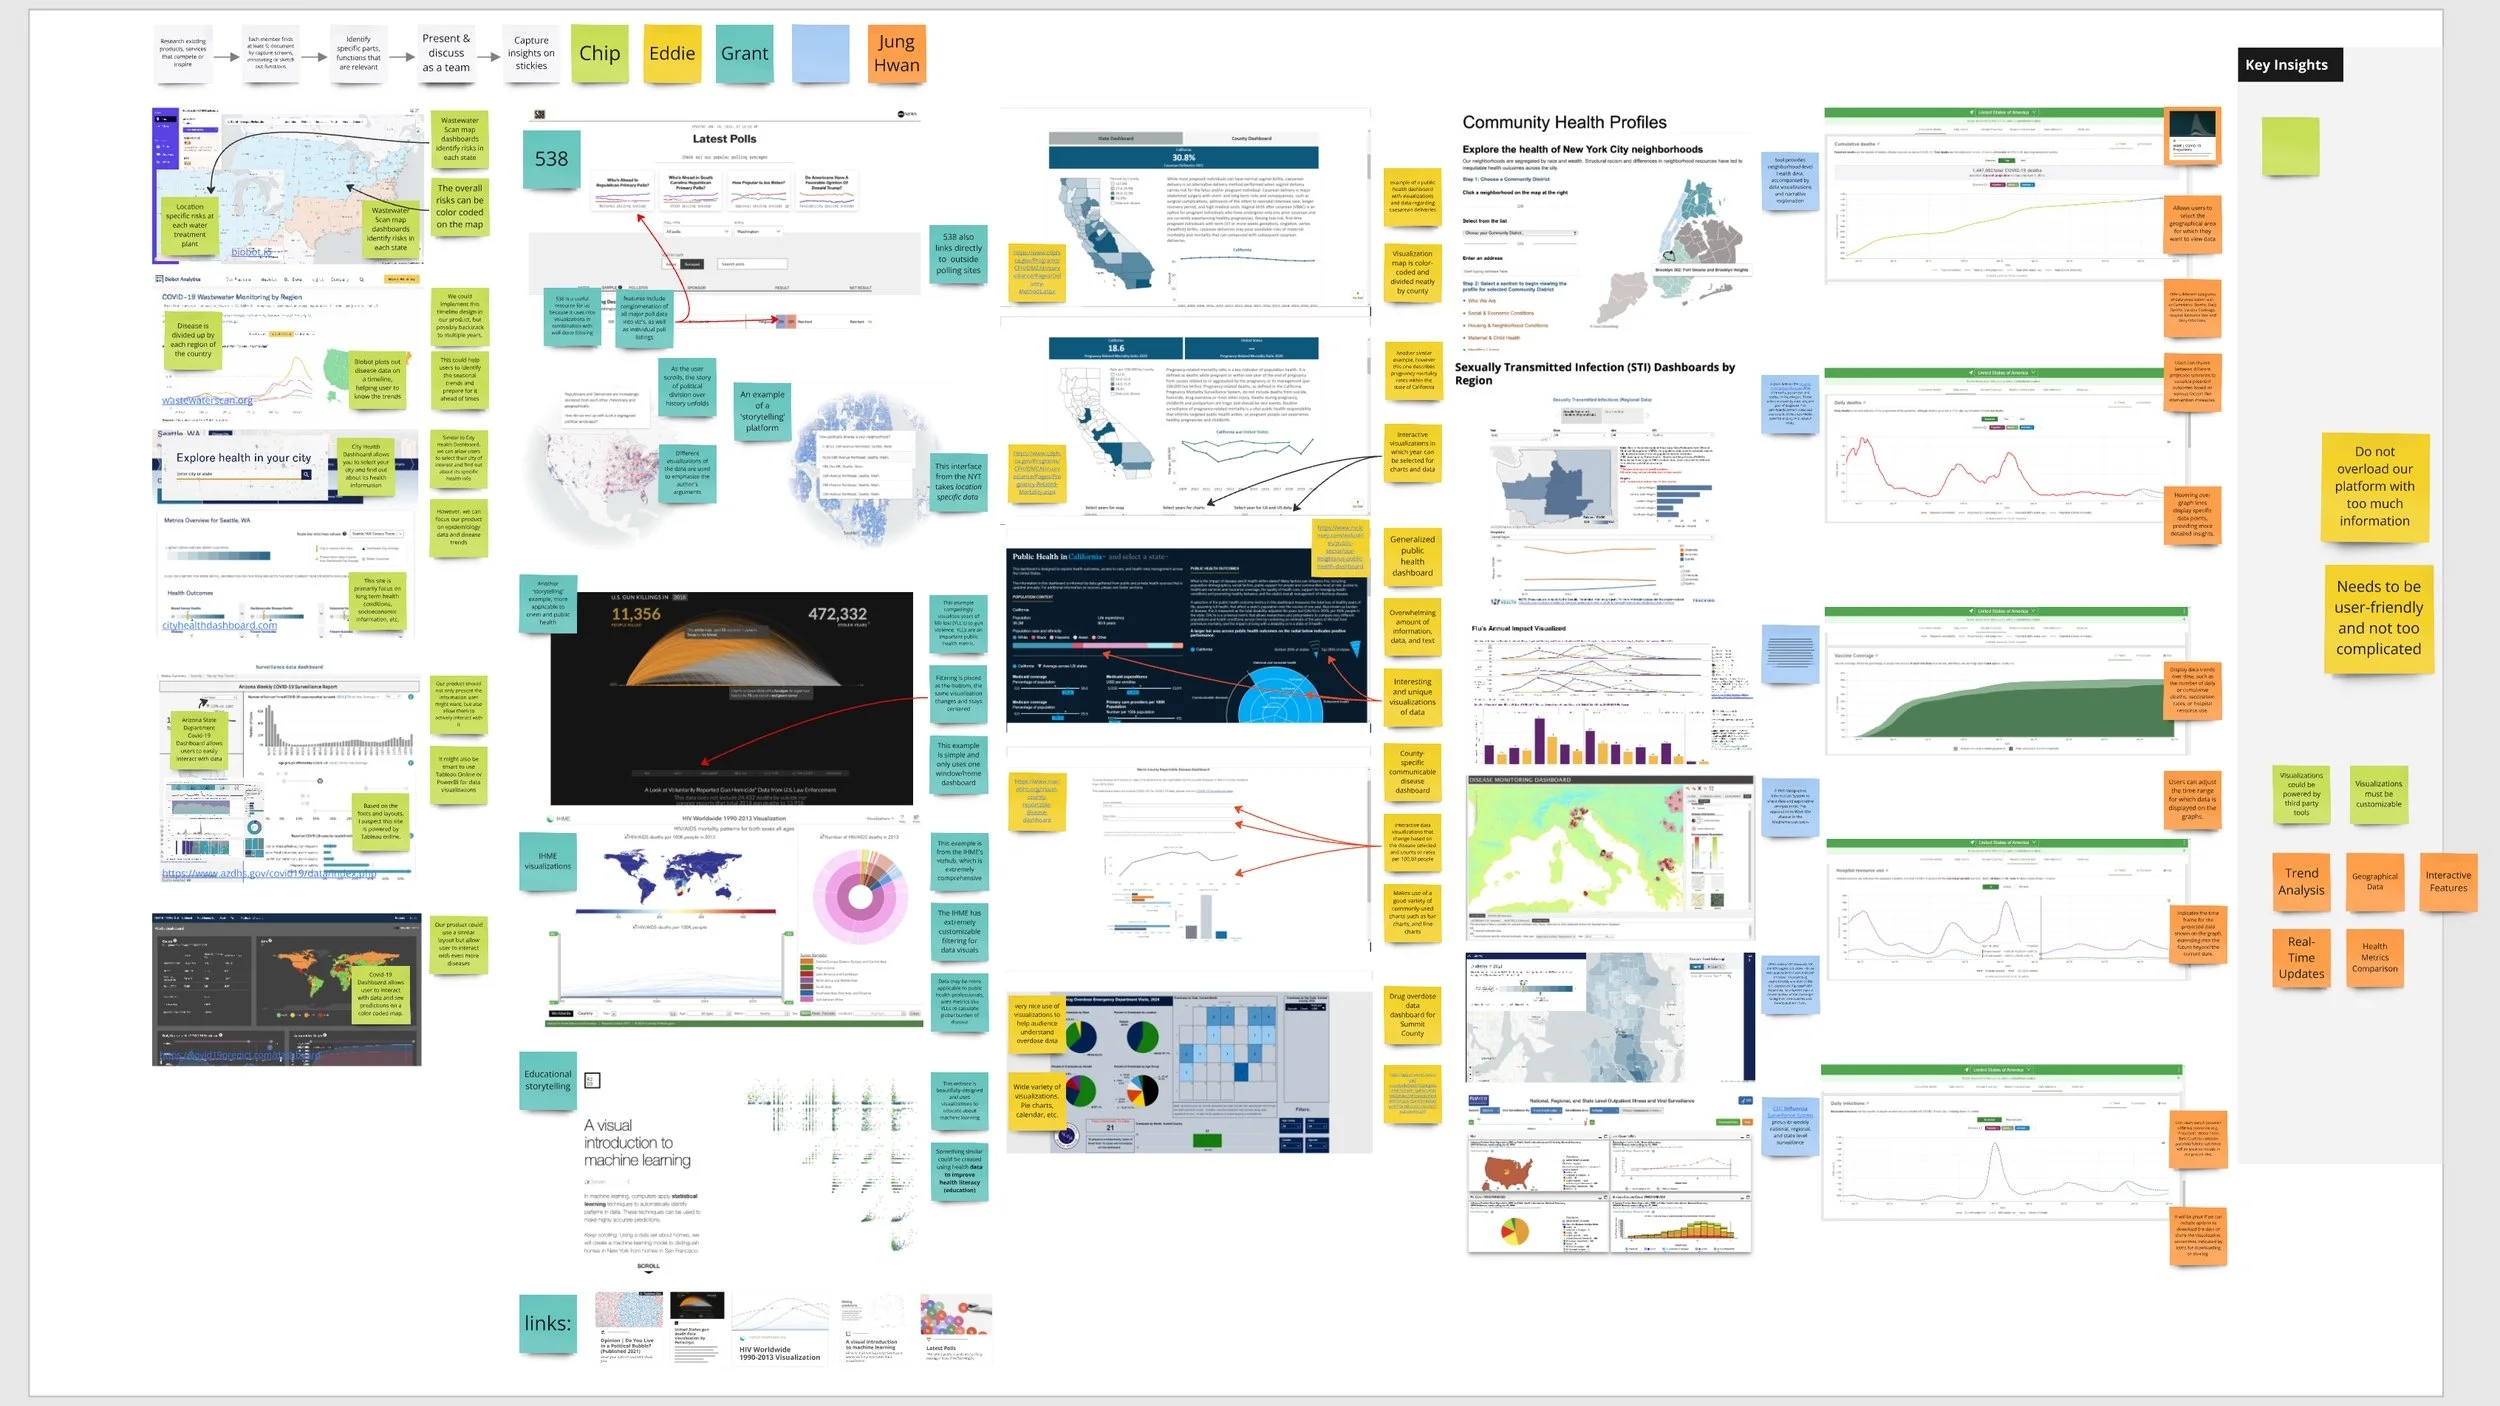
Market Research
User Research
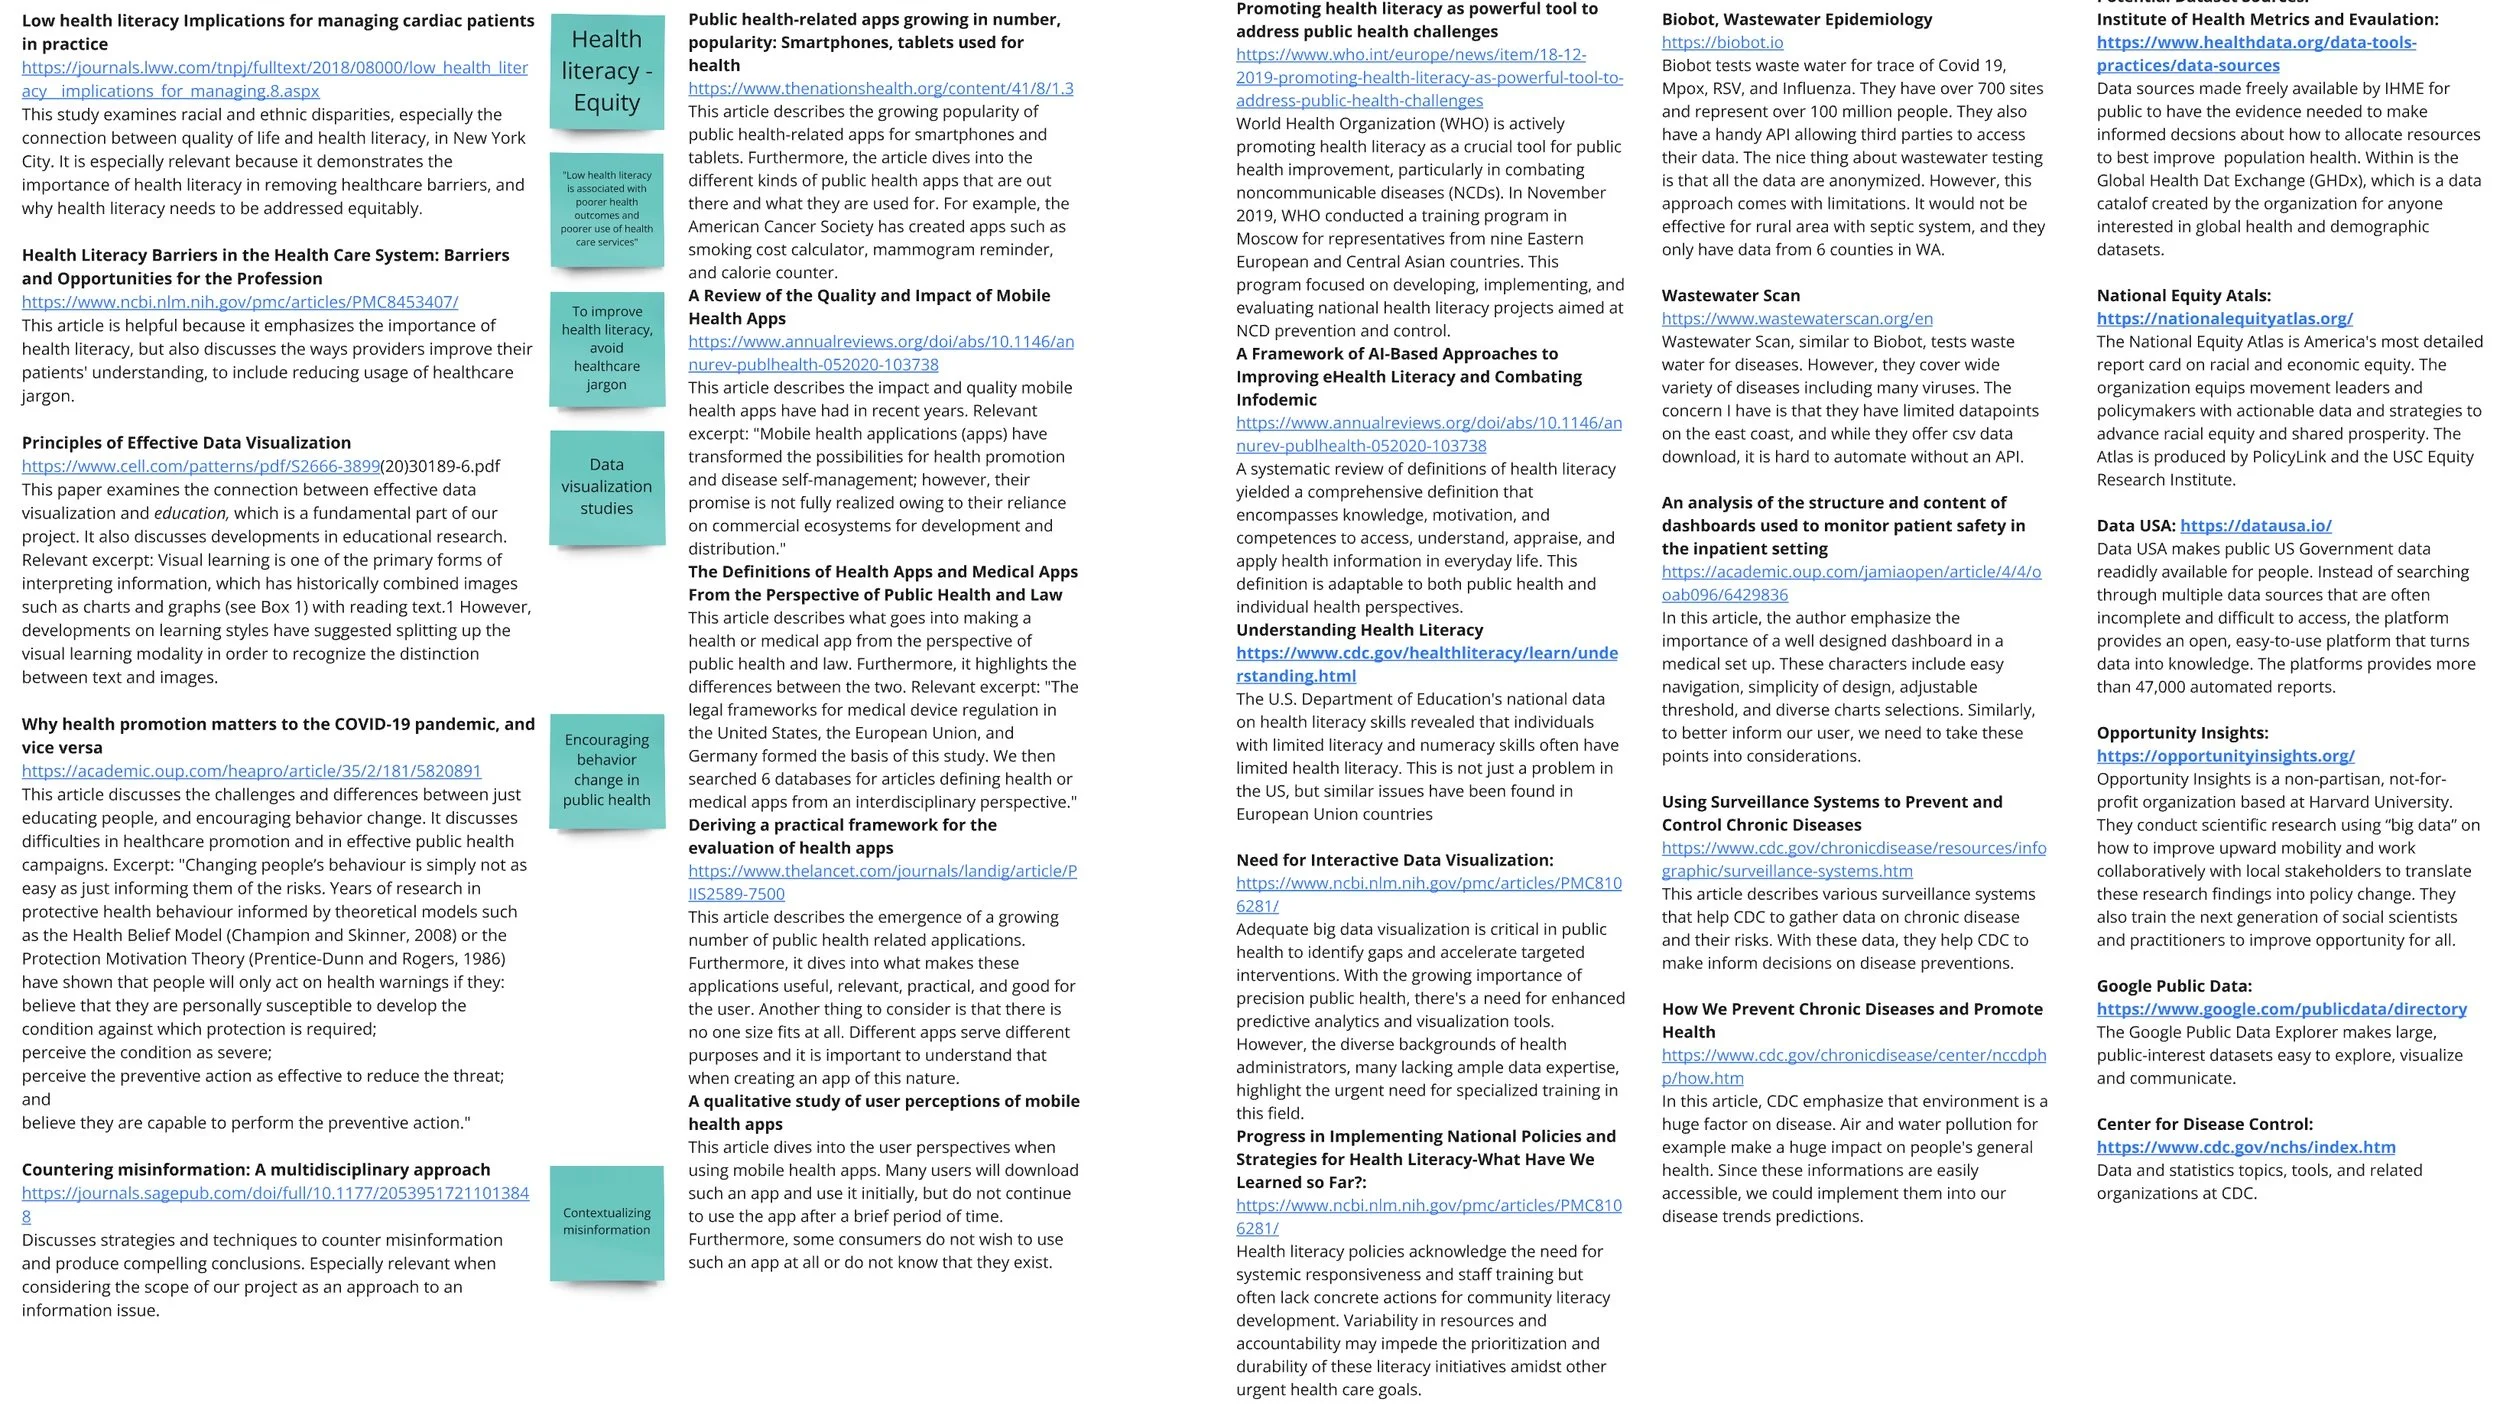
Solution Literature Review
Persona
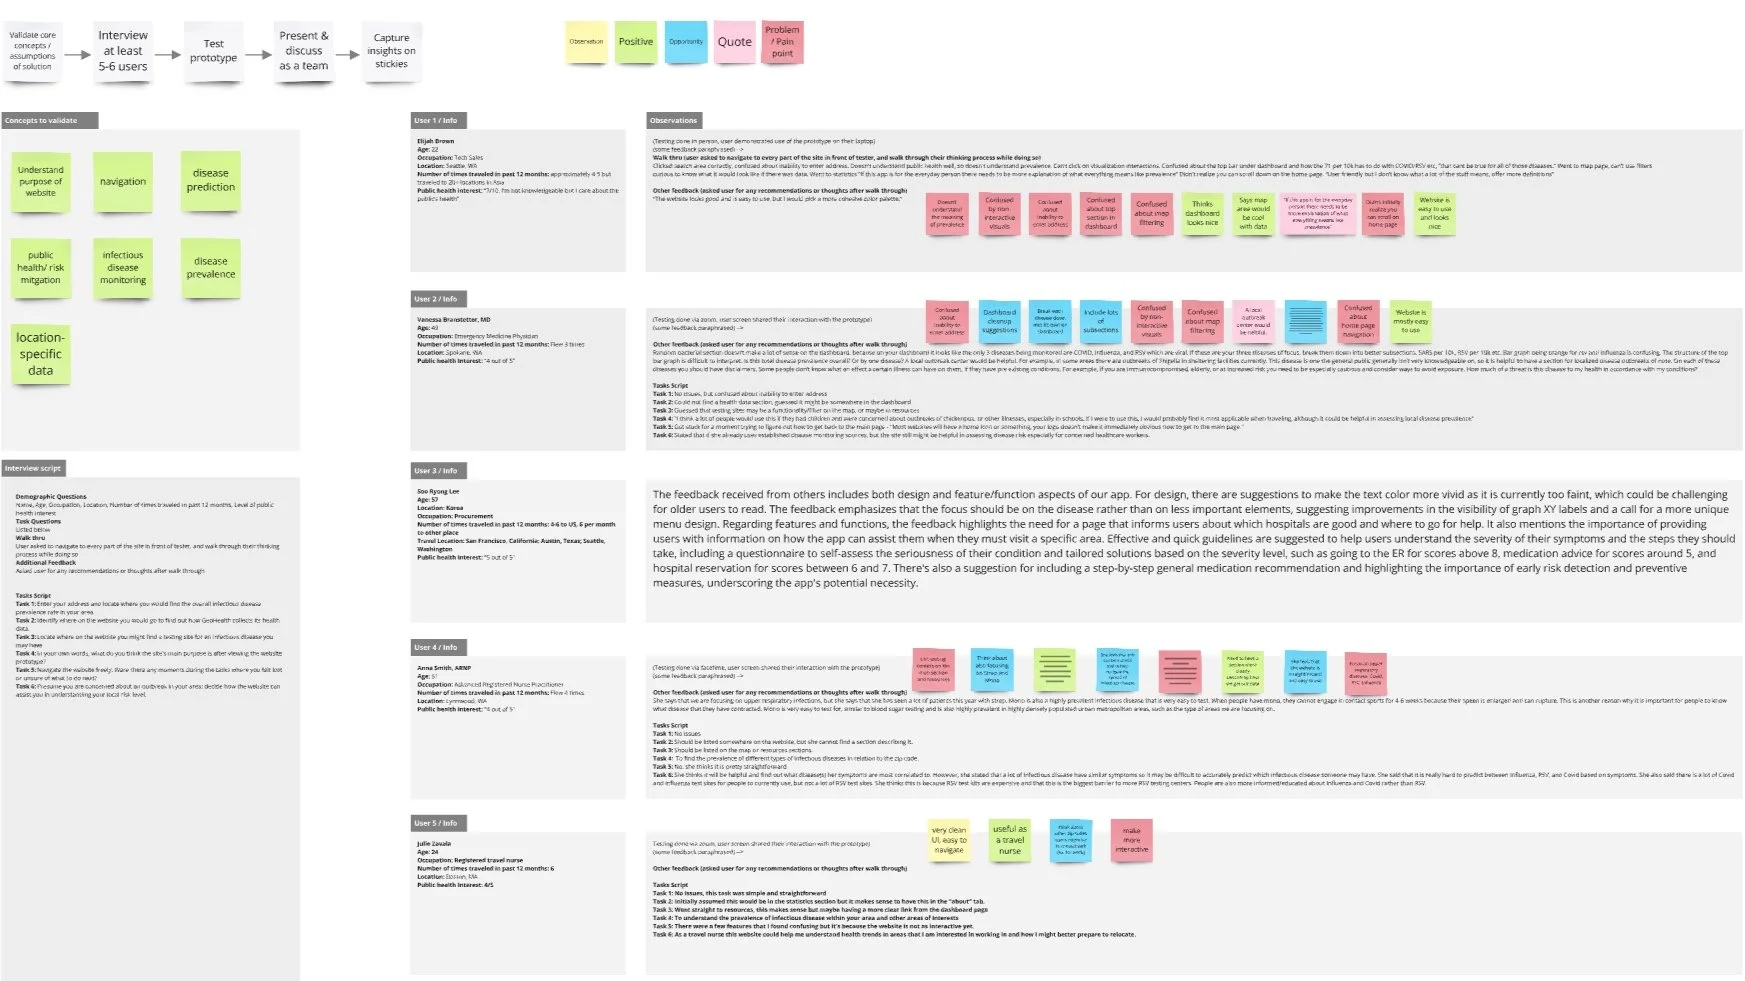
User Validation
Wireframe Prototype
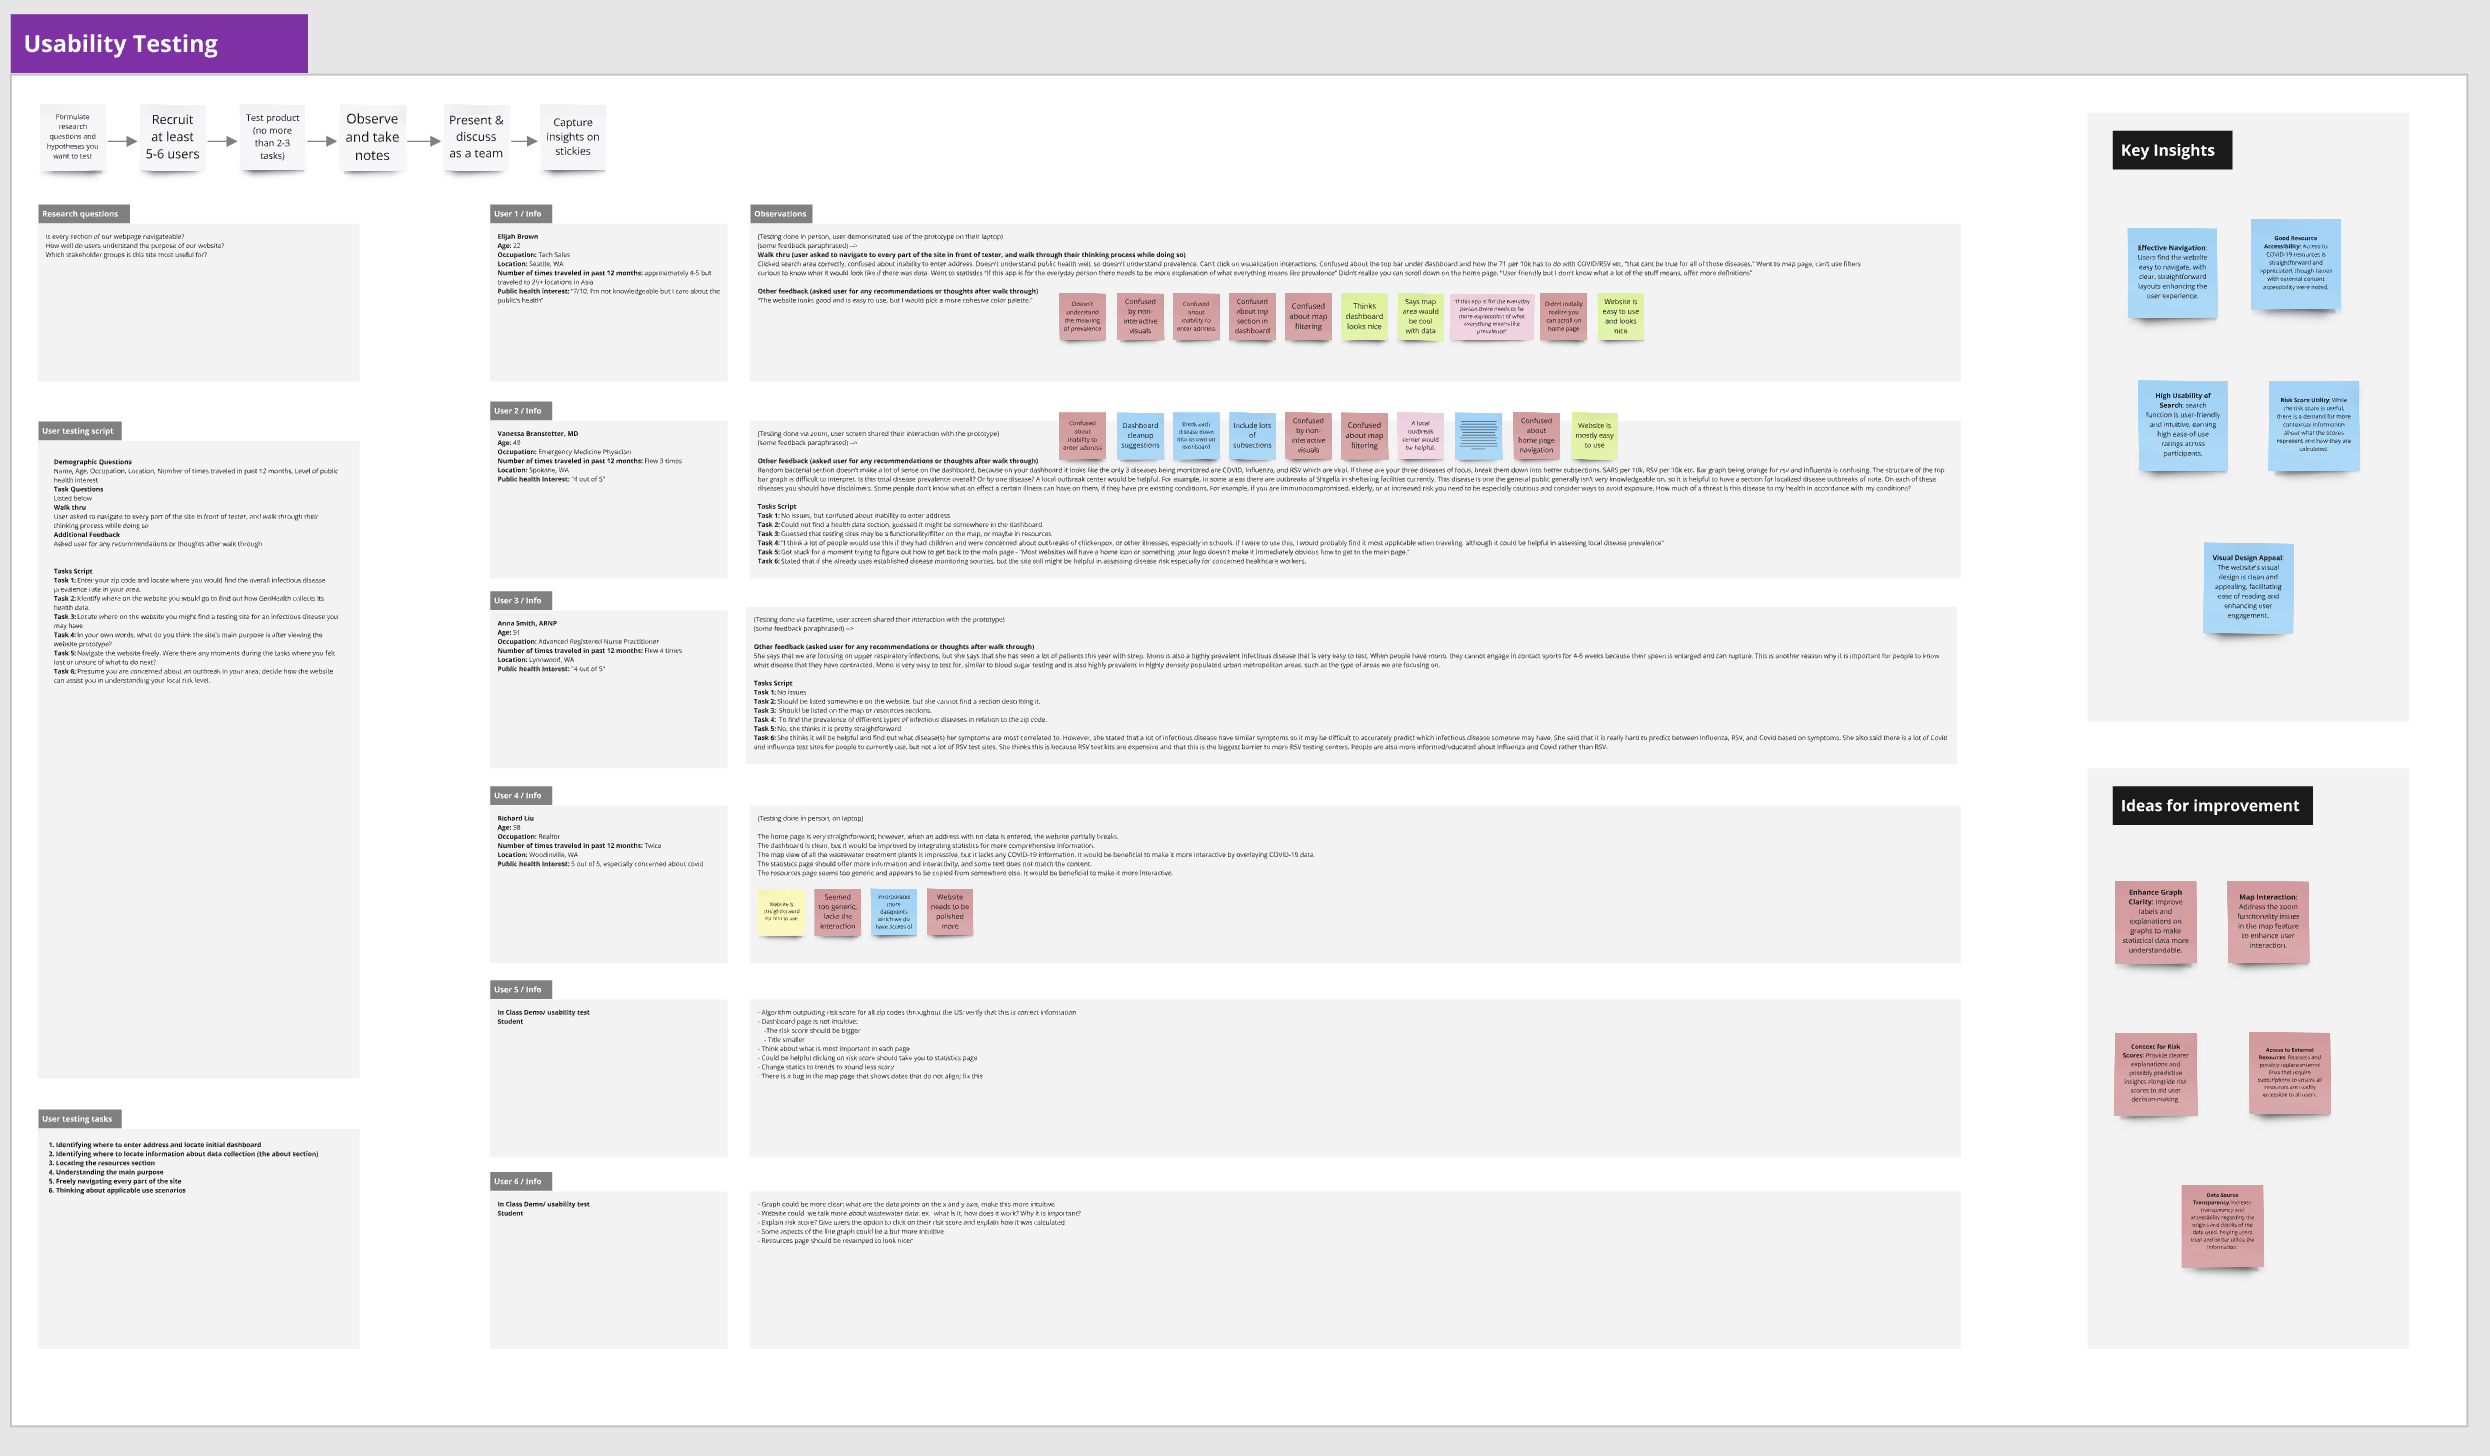
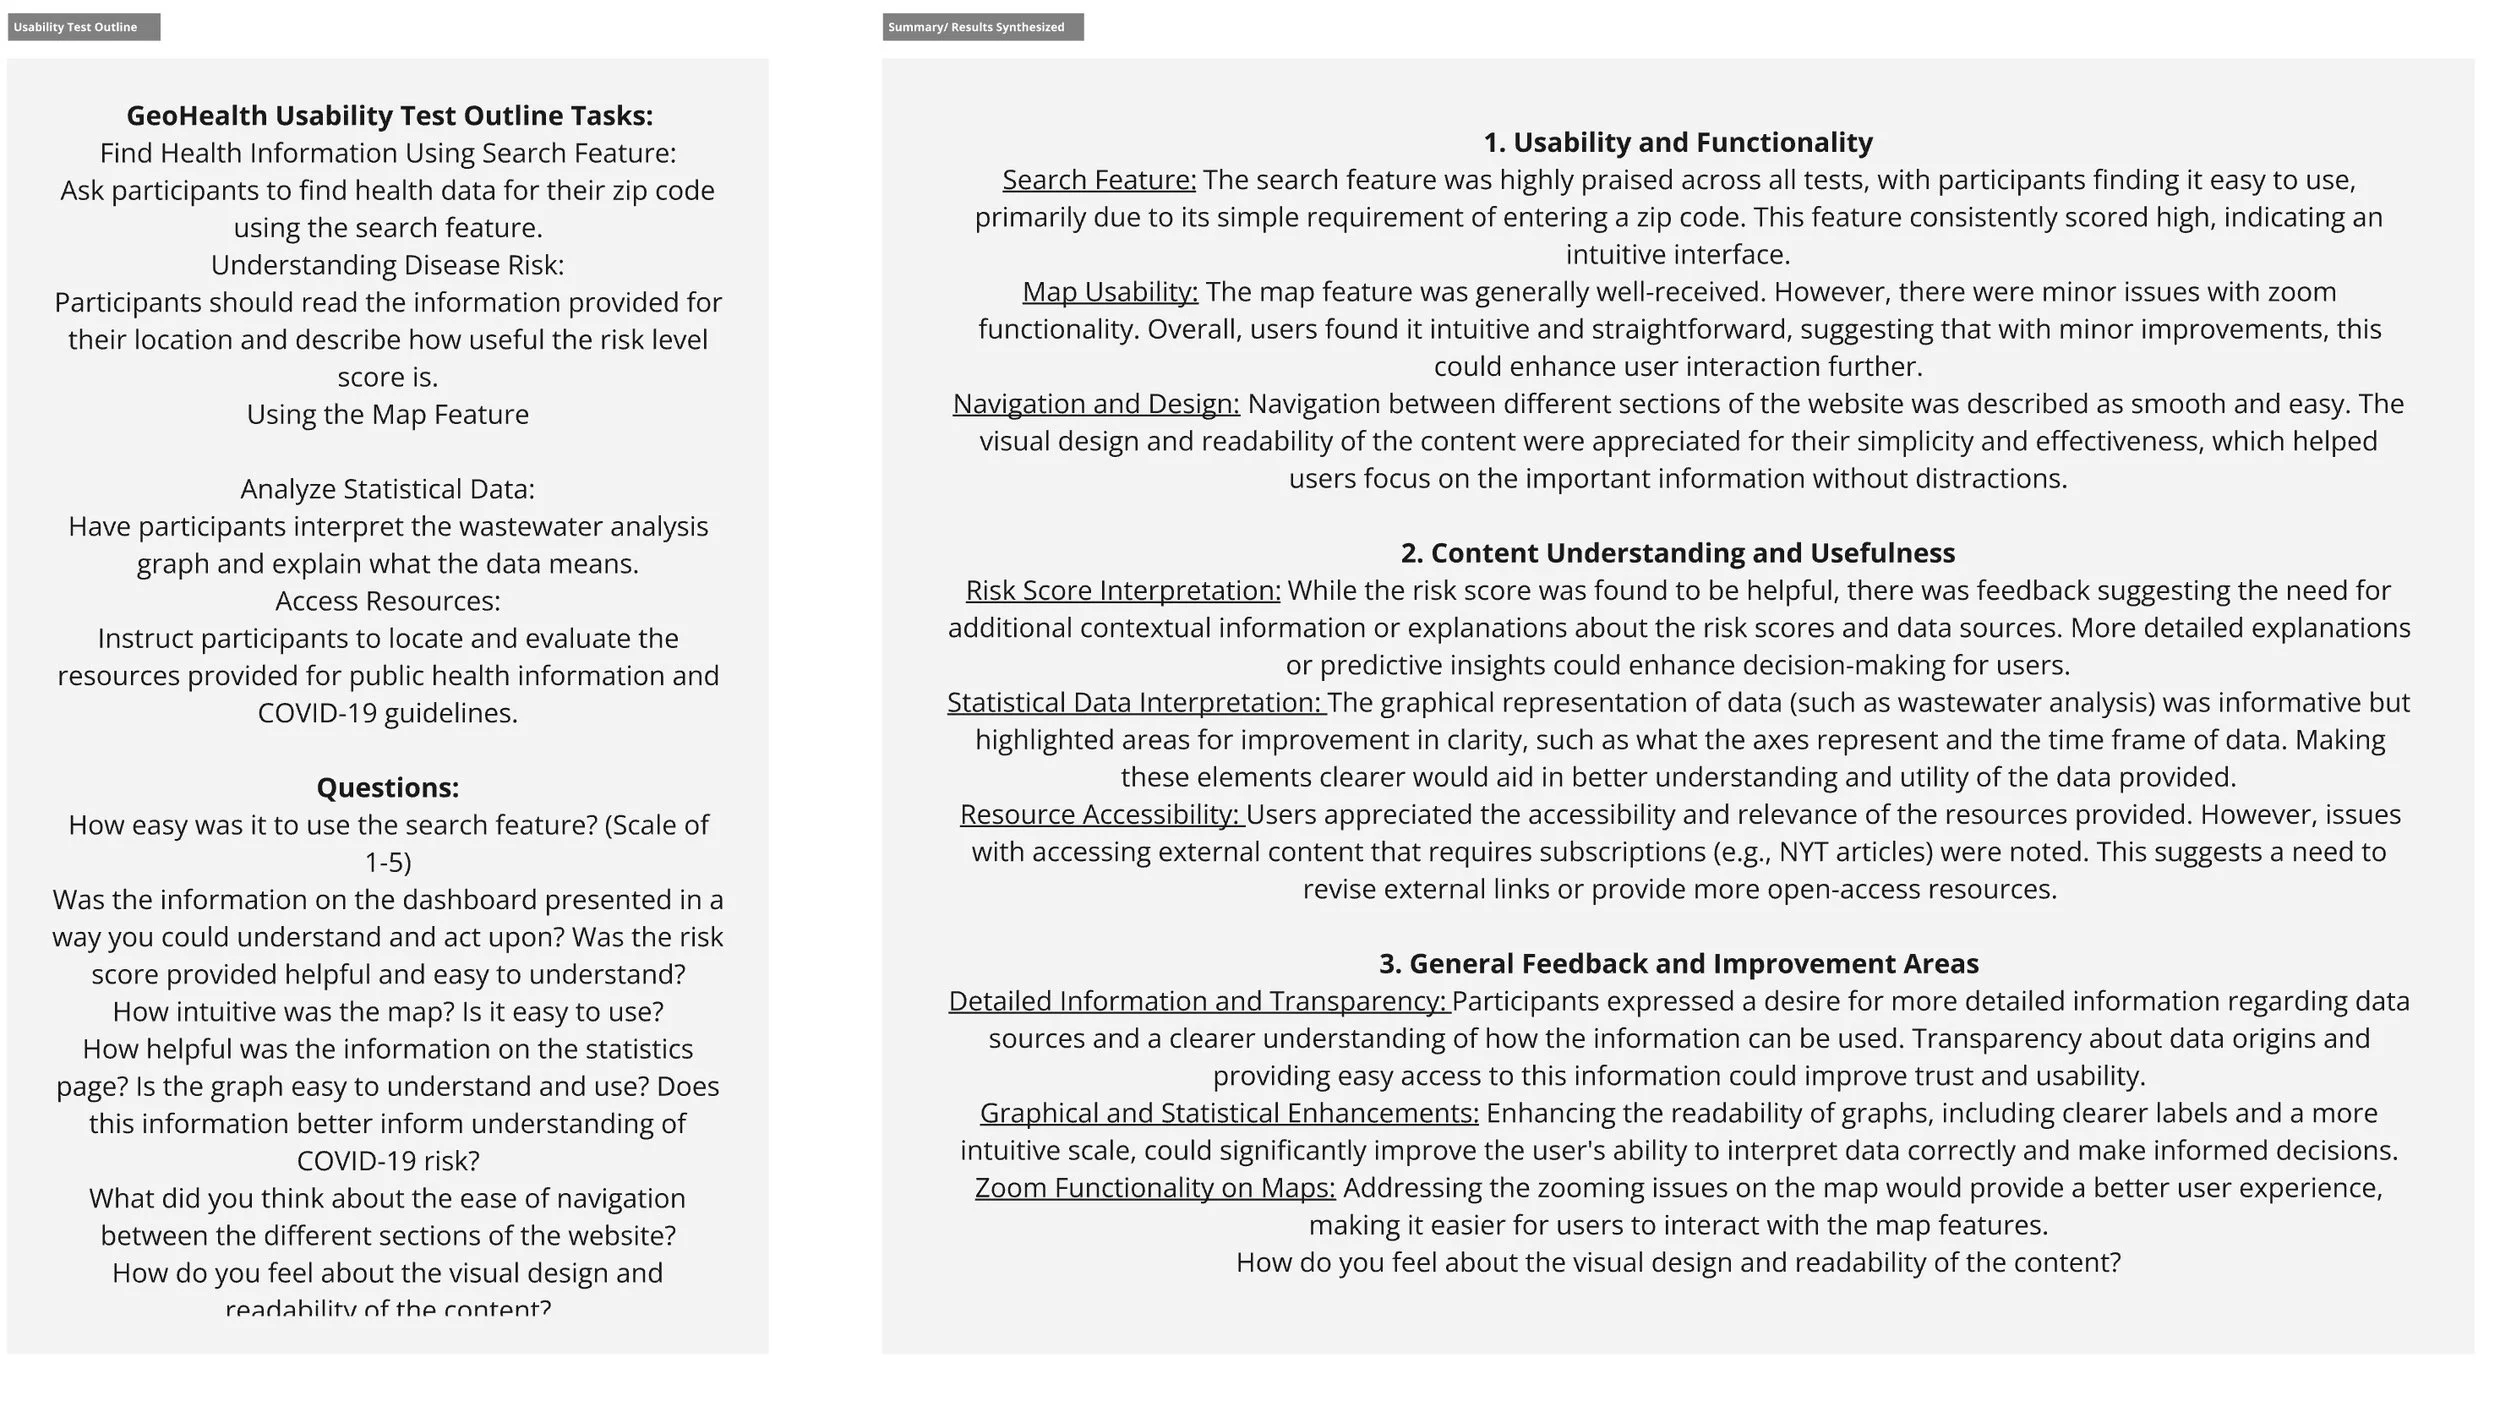
Usability Testing
User Testing
4theYouth - After School Camp Management
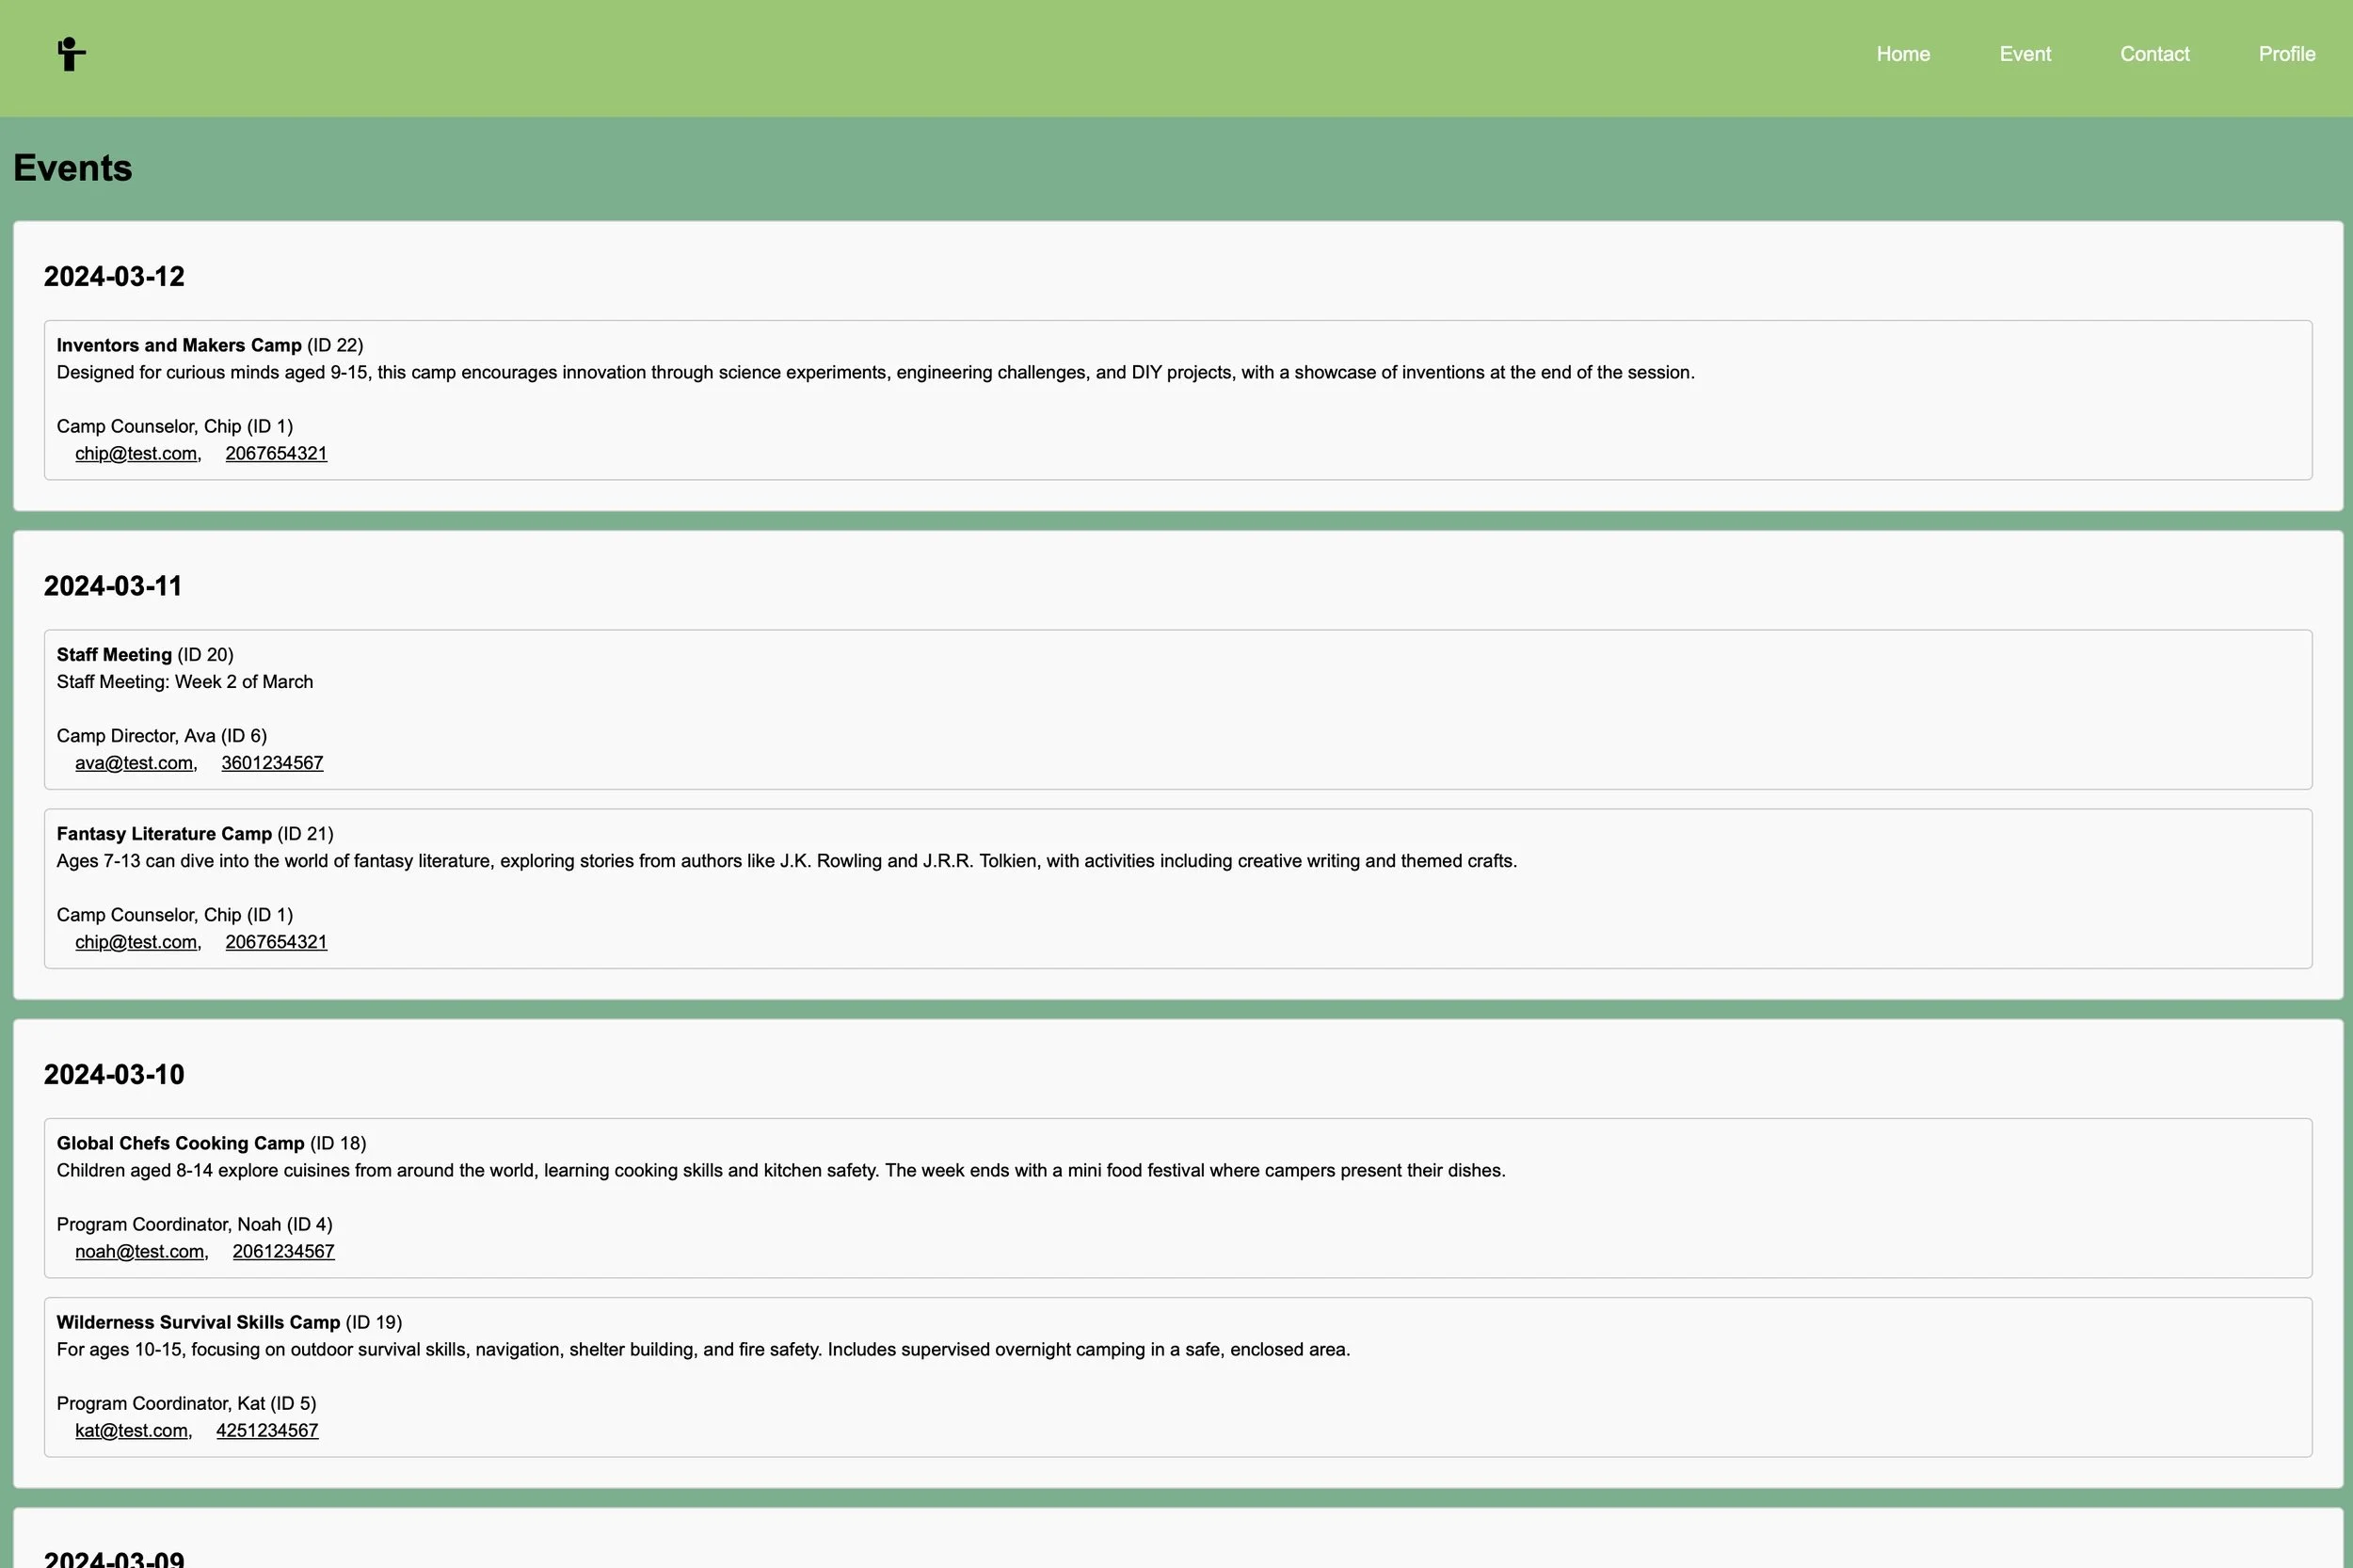
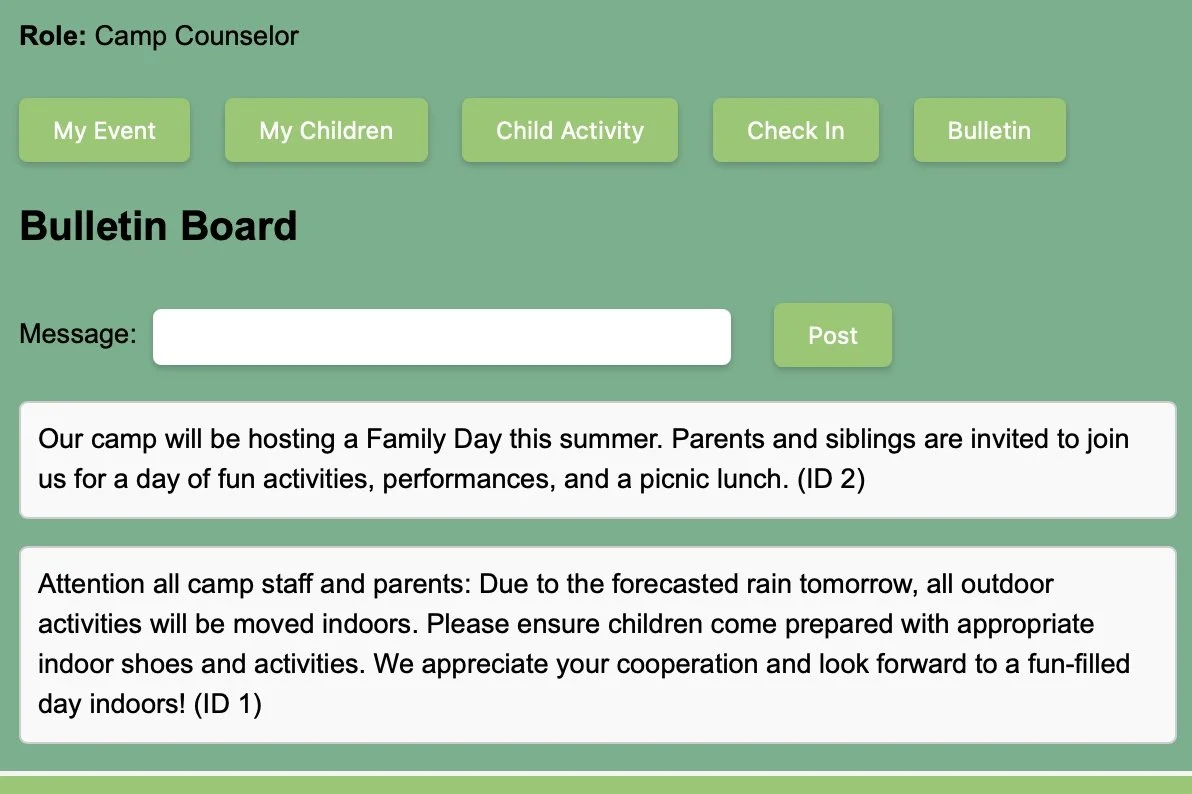
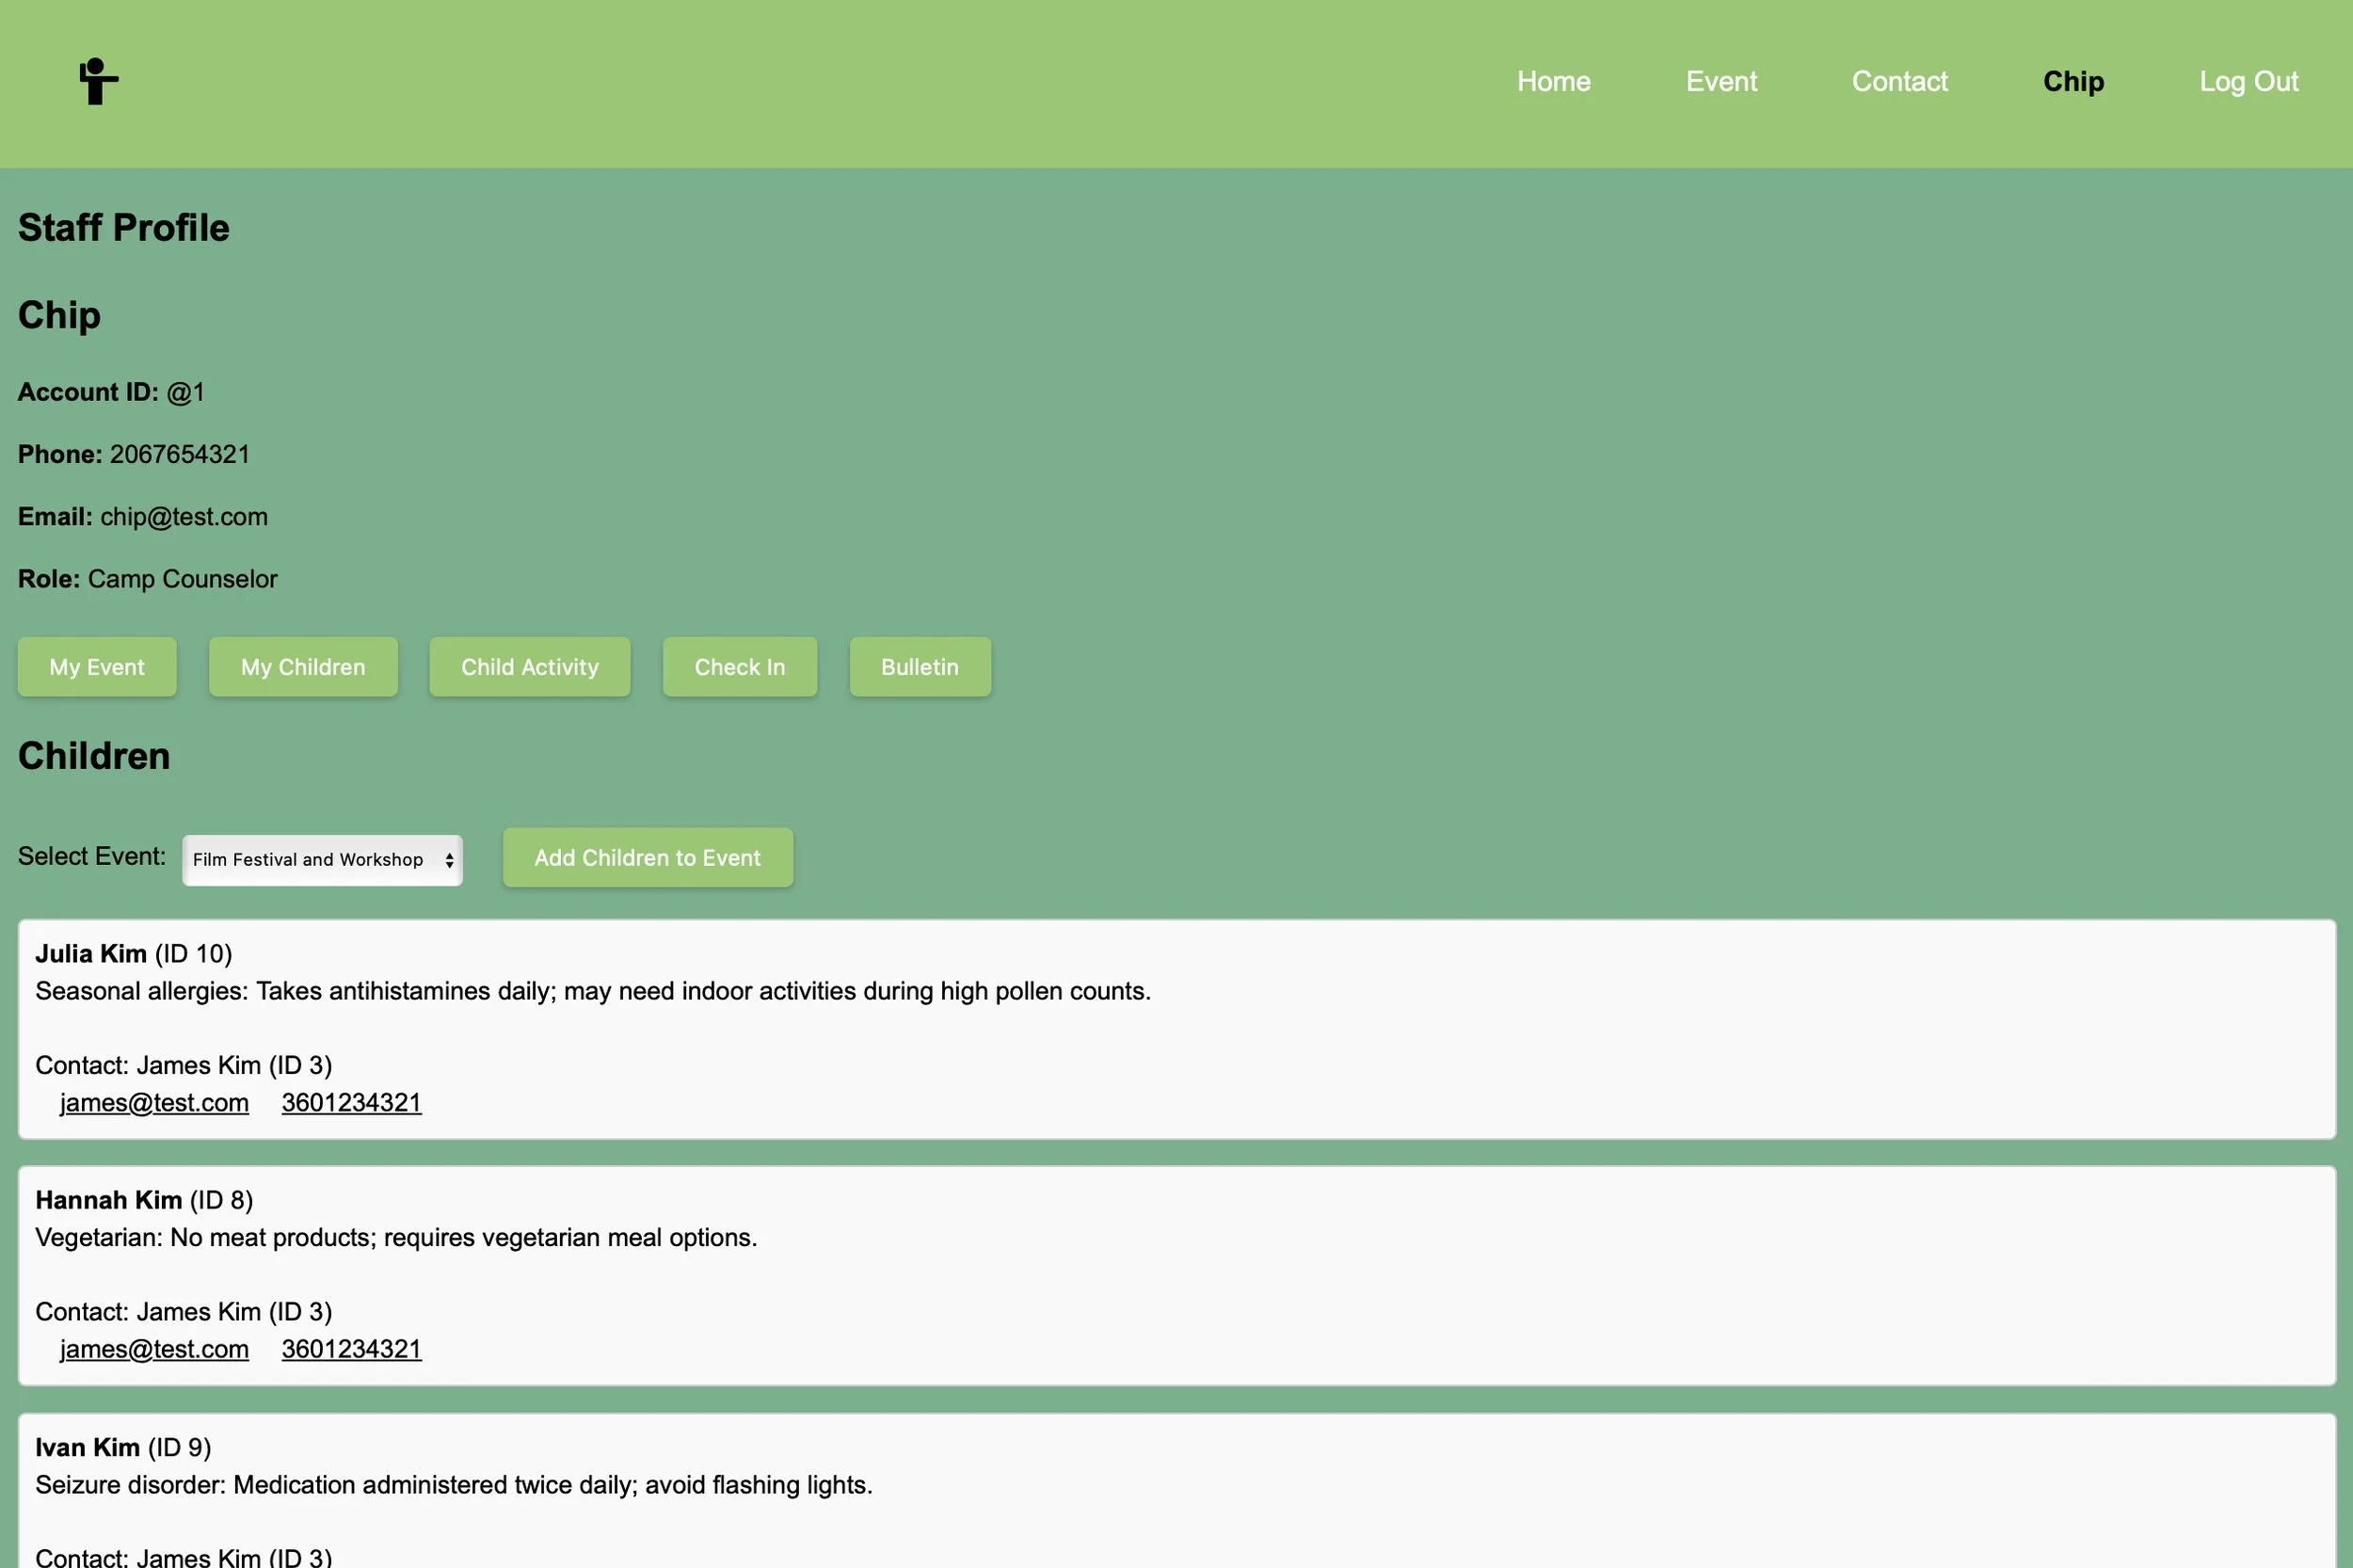
The website 4theYouth serves as a comprehensive platform for managing after-school activities, facilitating seamless interaction between staff and parents. Users can sign up, view schedules, manage children's participation, plan or register for events, and establish points of contact. The platform includes a robust sign-up and login system with customizable password protection, enabling a tailored experience for each counselor and parent. The site features a fully functional frontend and backend powered by Node.js, seamlessly integrated with an SQLite database. It is hosted on Chip's Rocket Linux server.
US Presidential Election Analysis
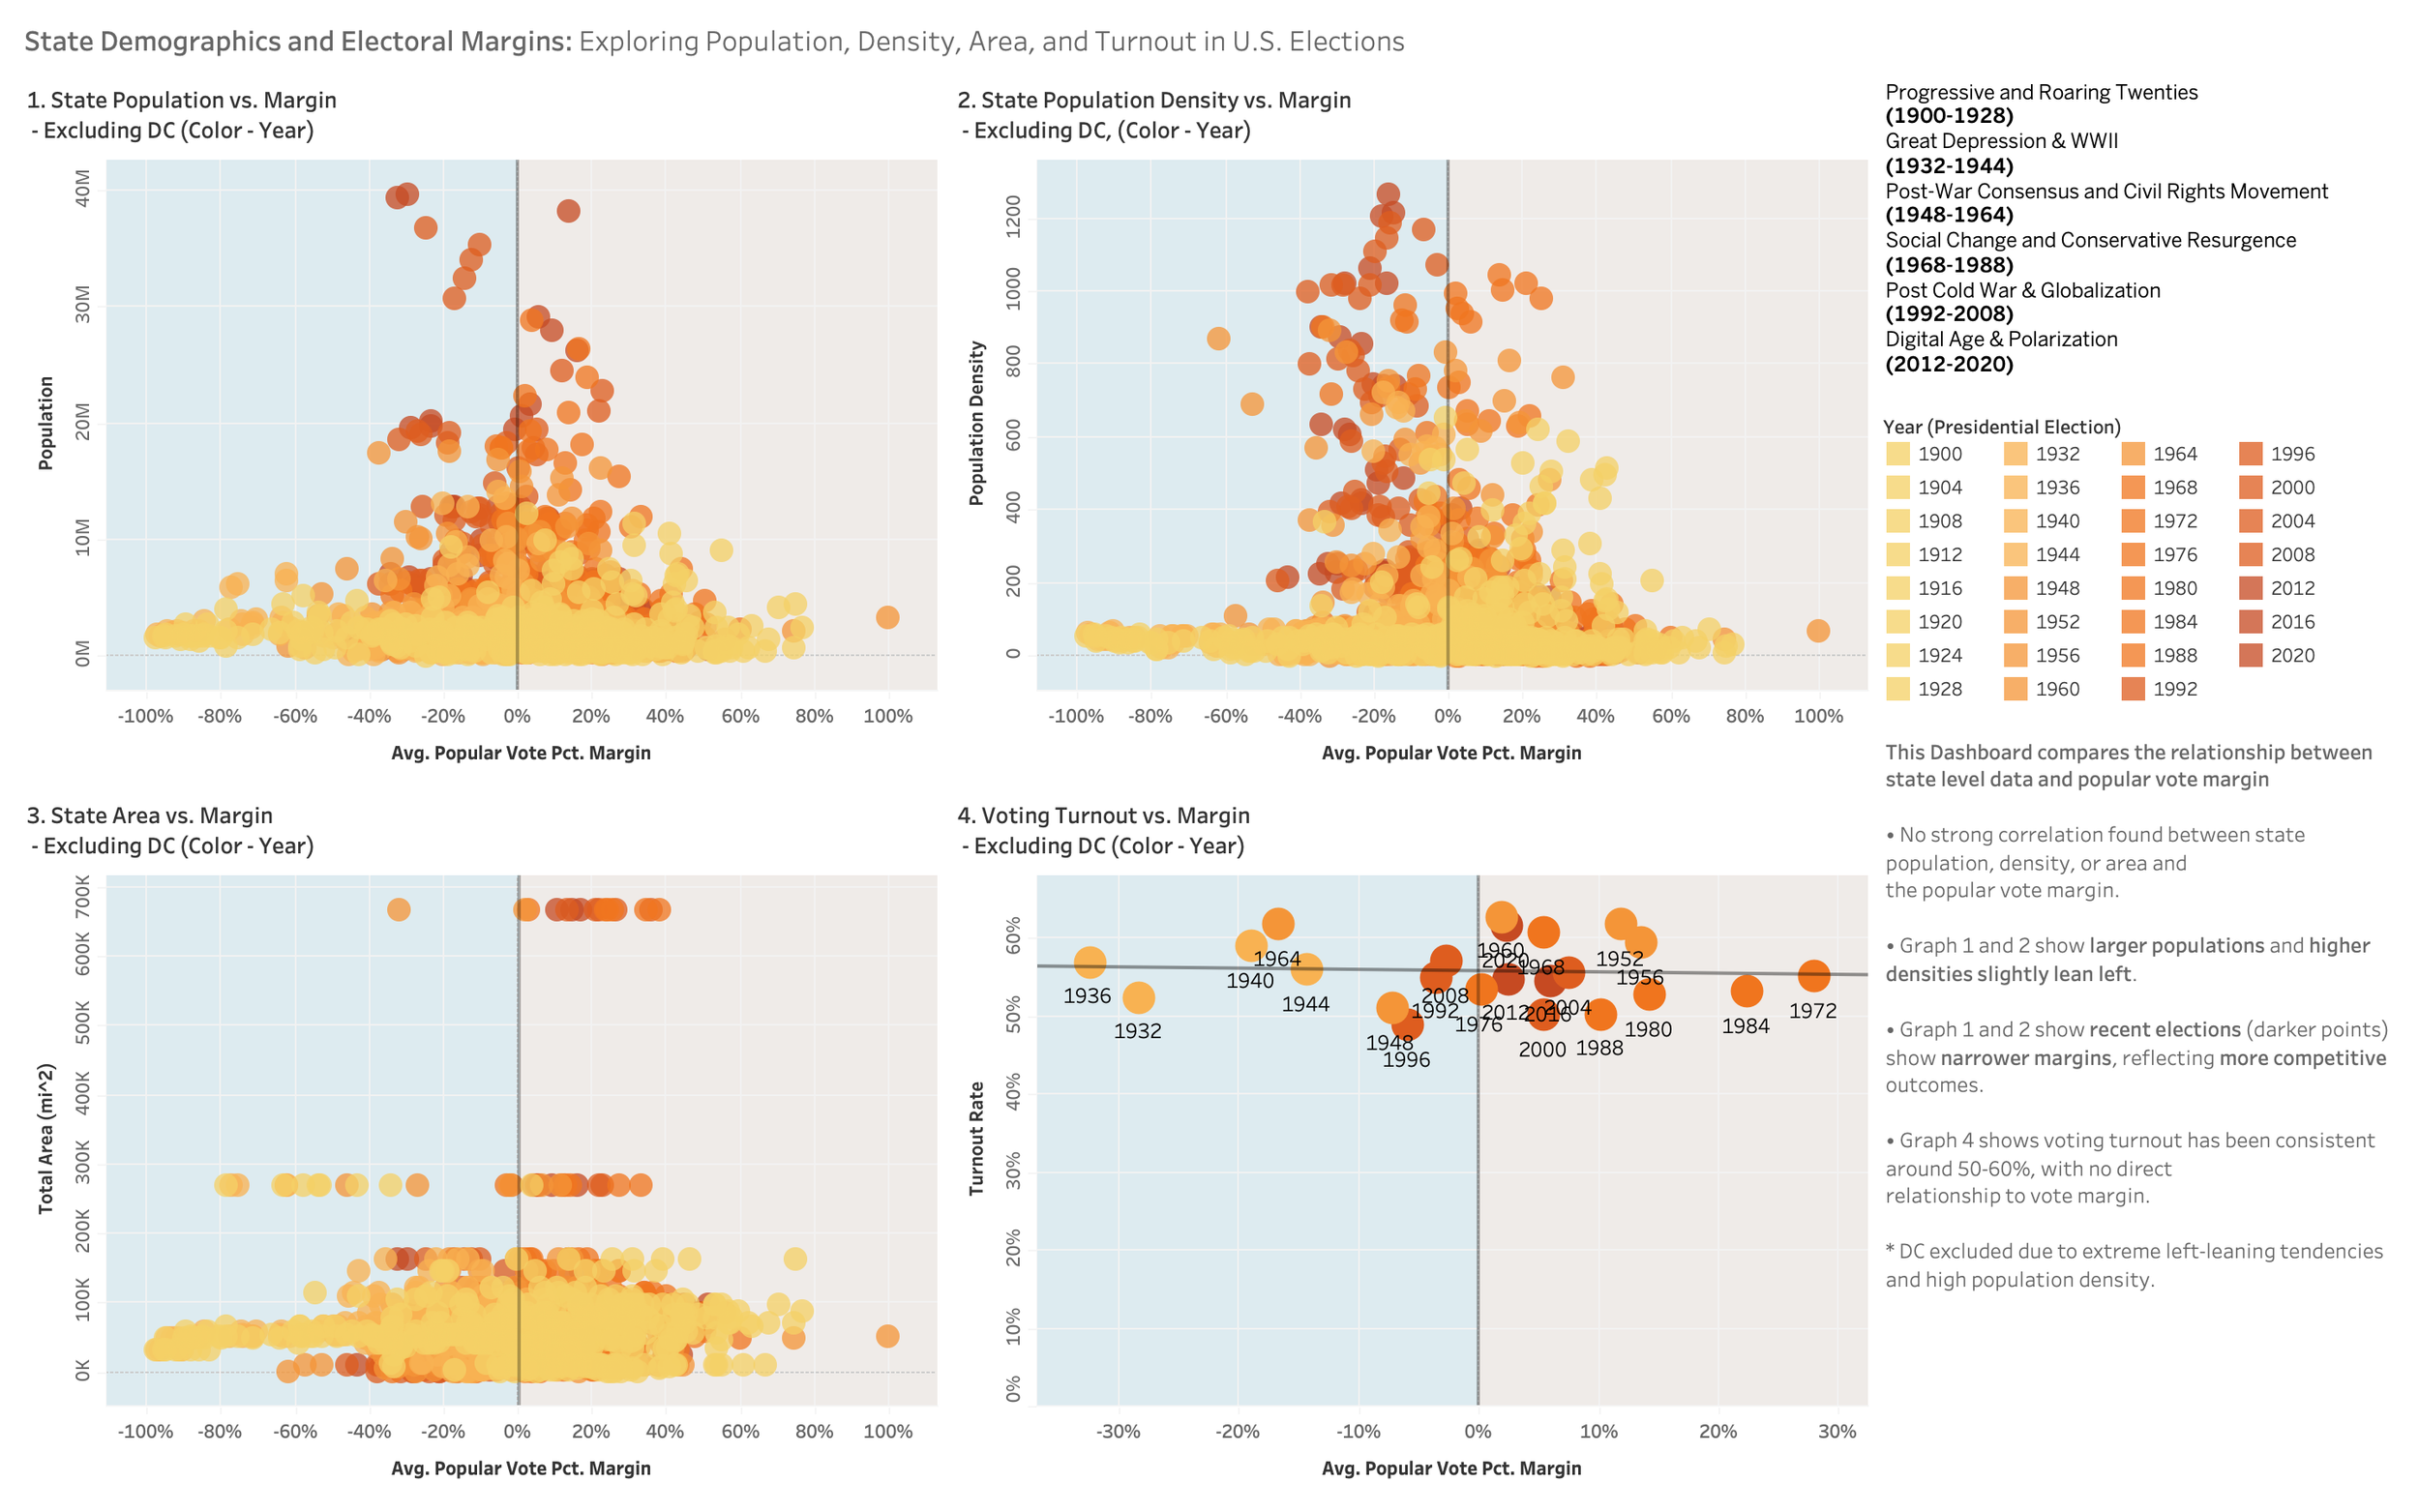
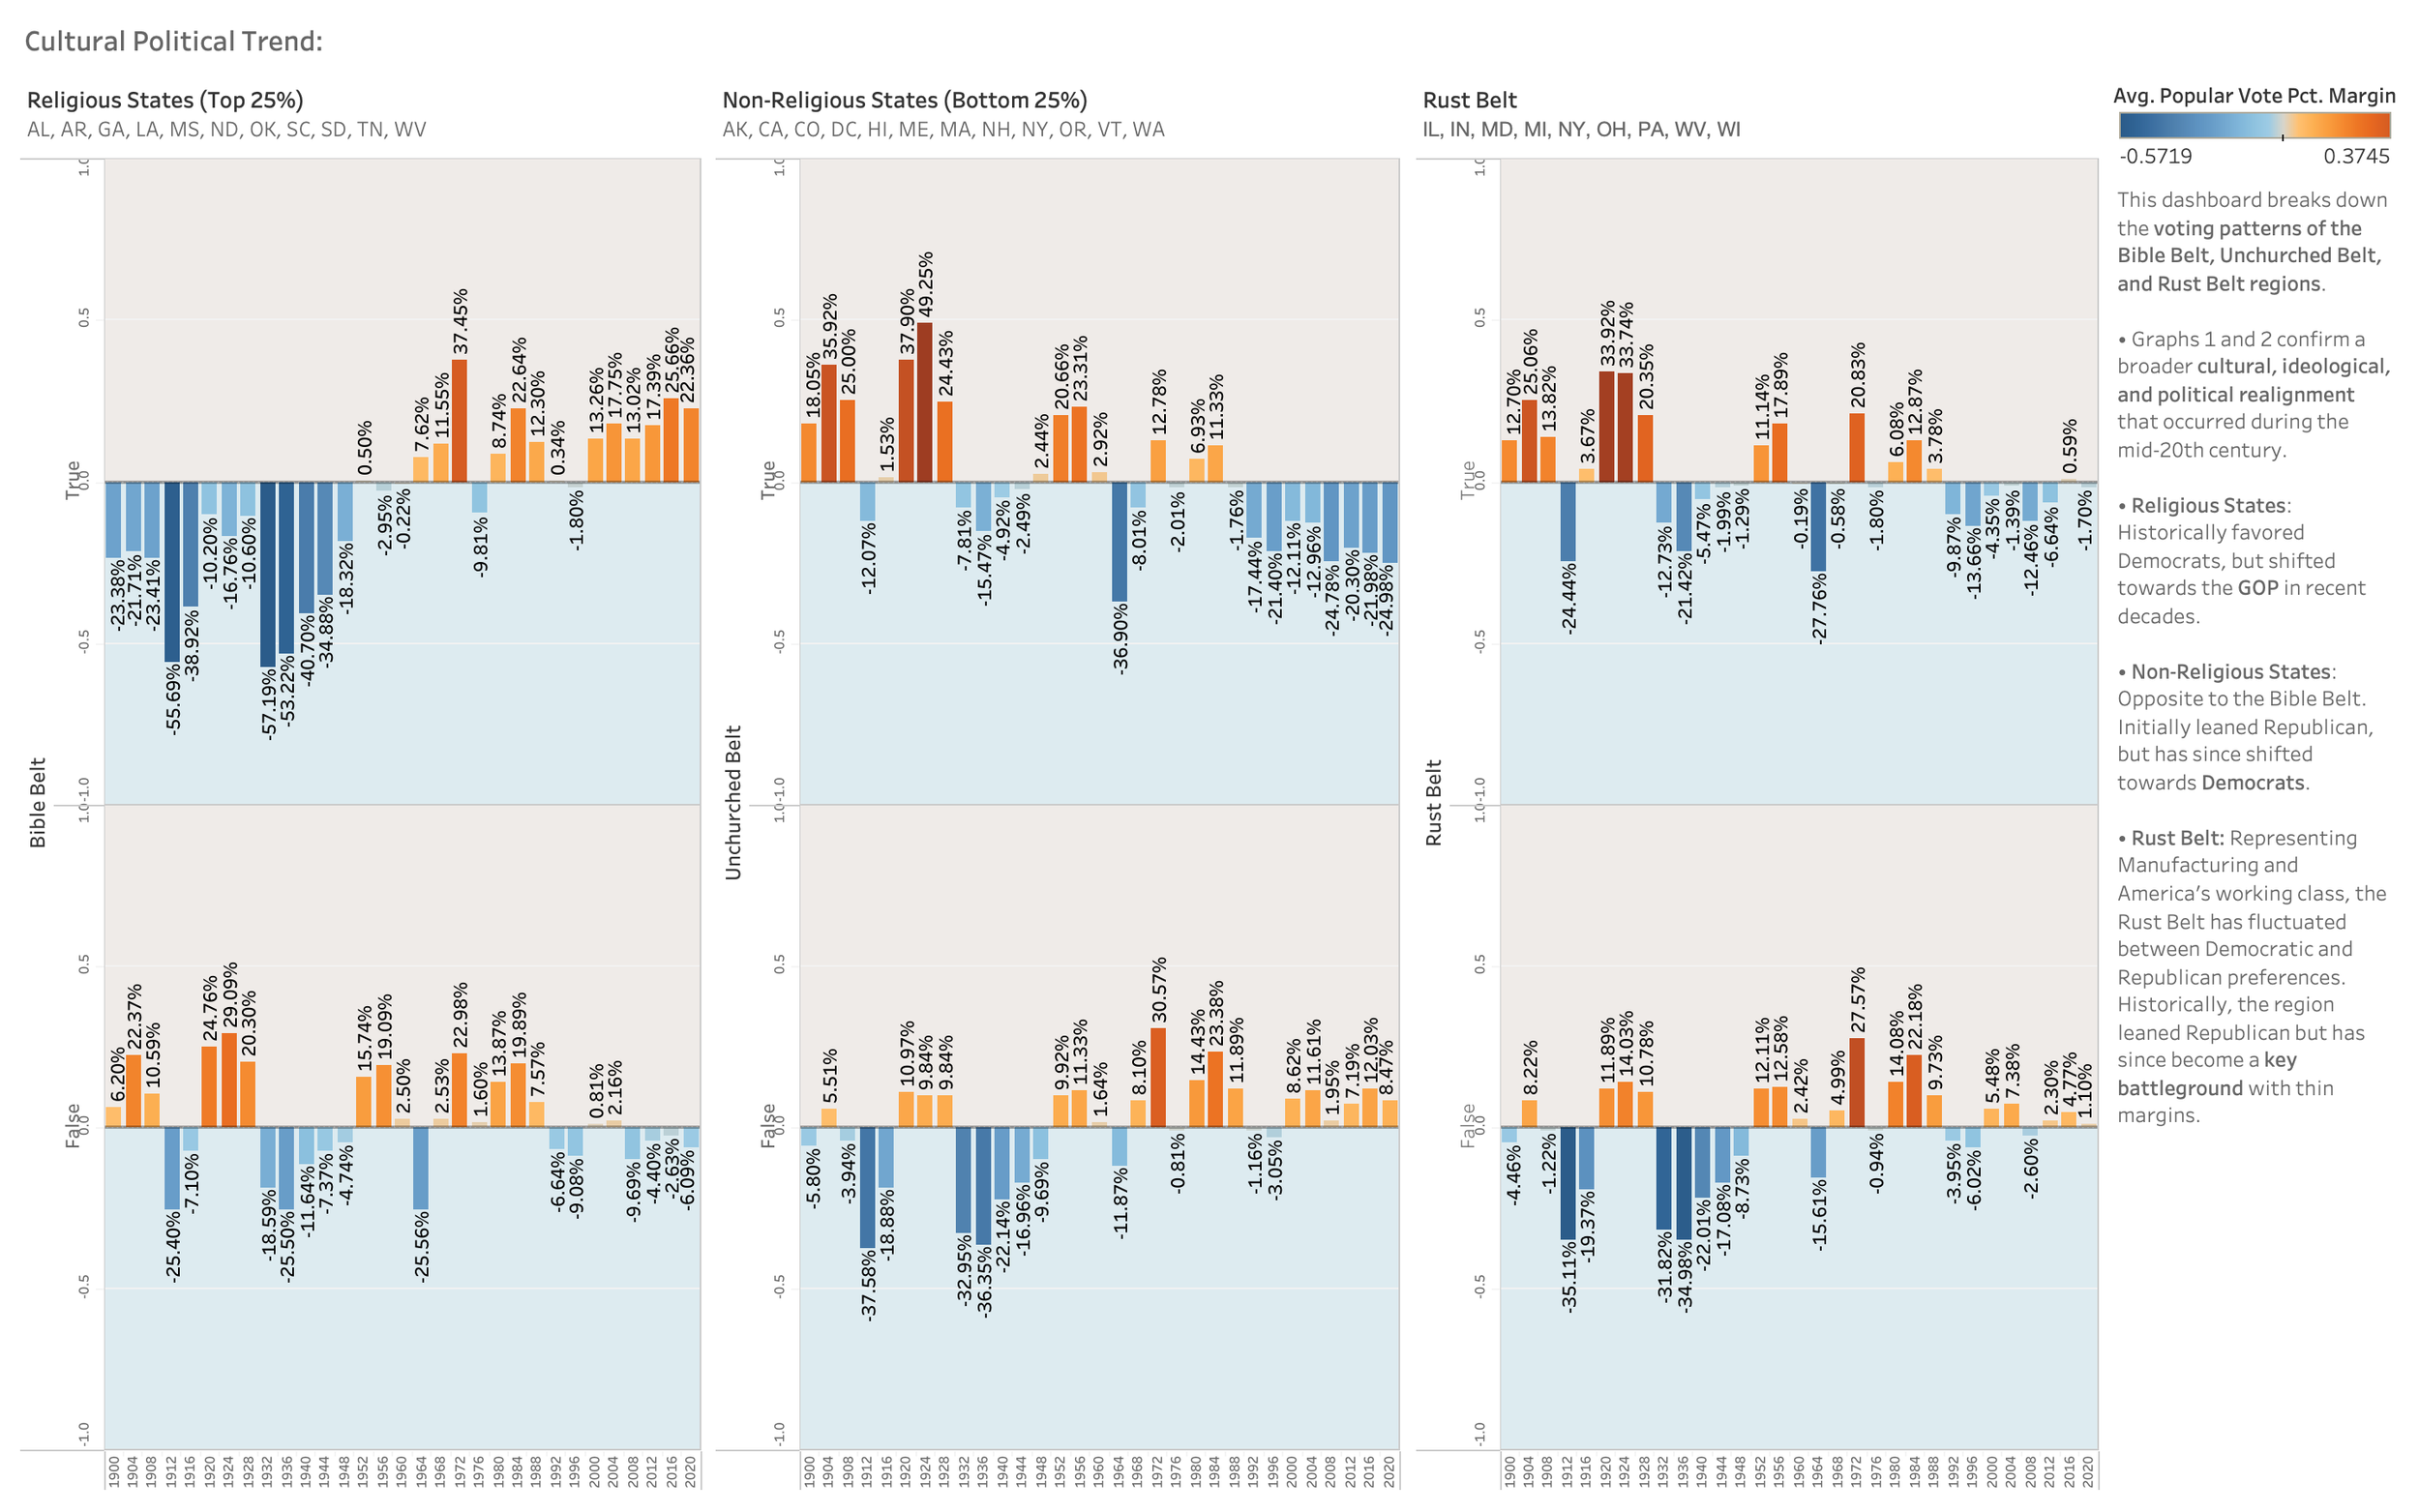
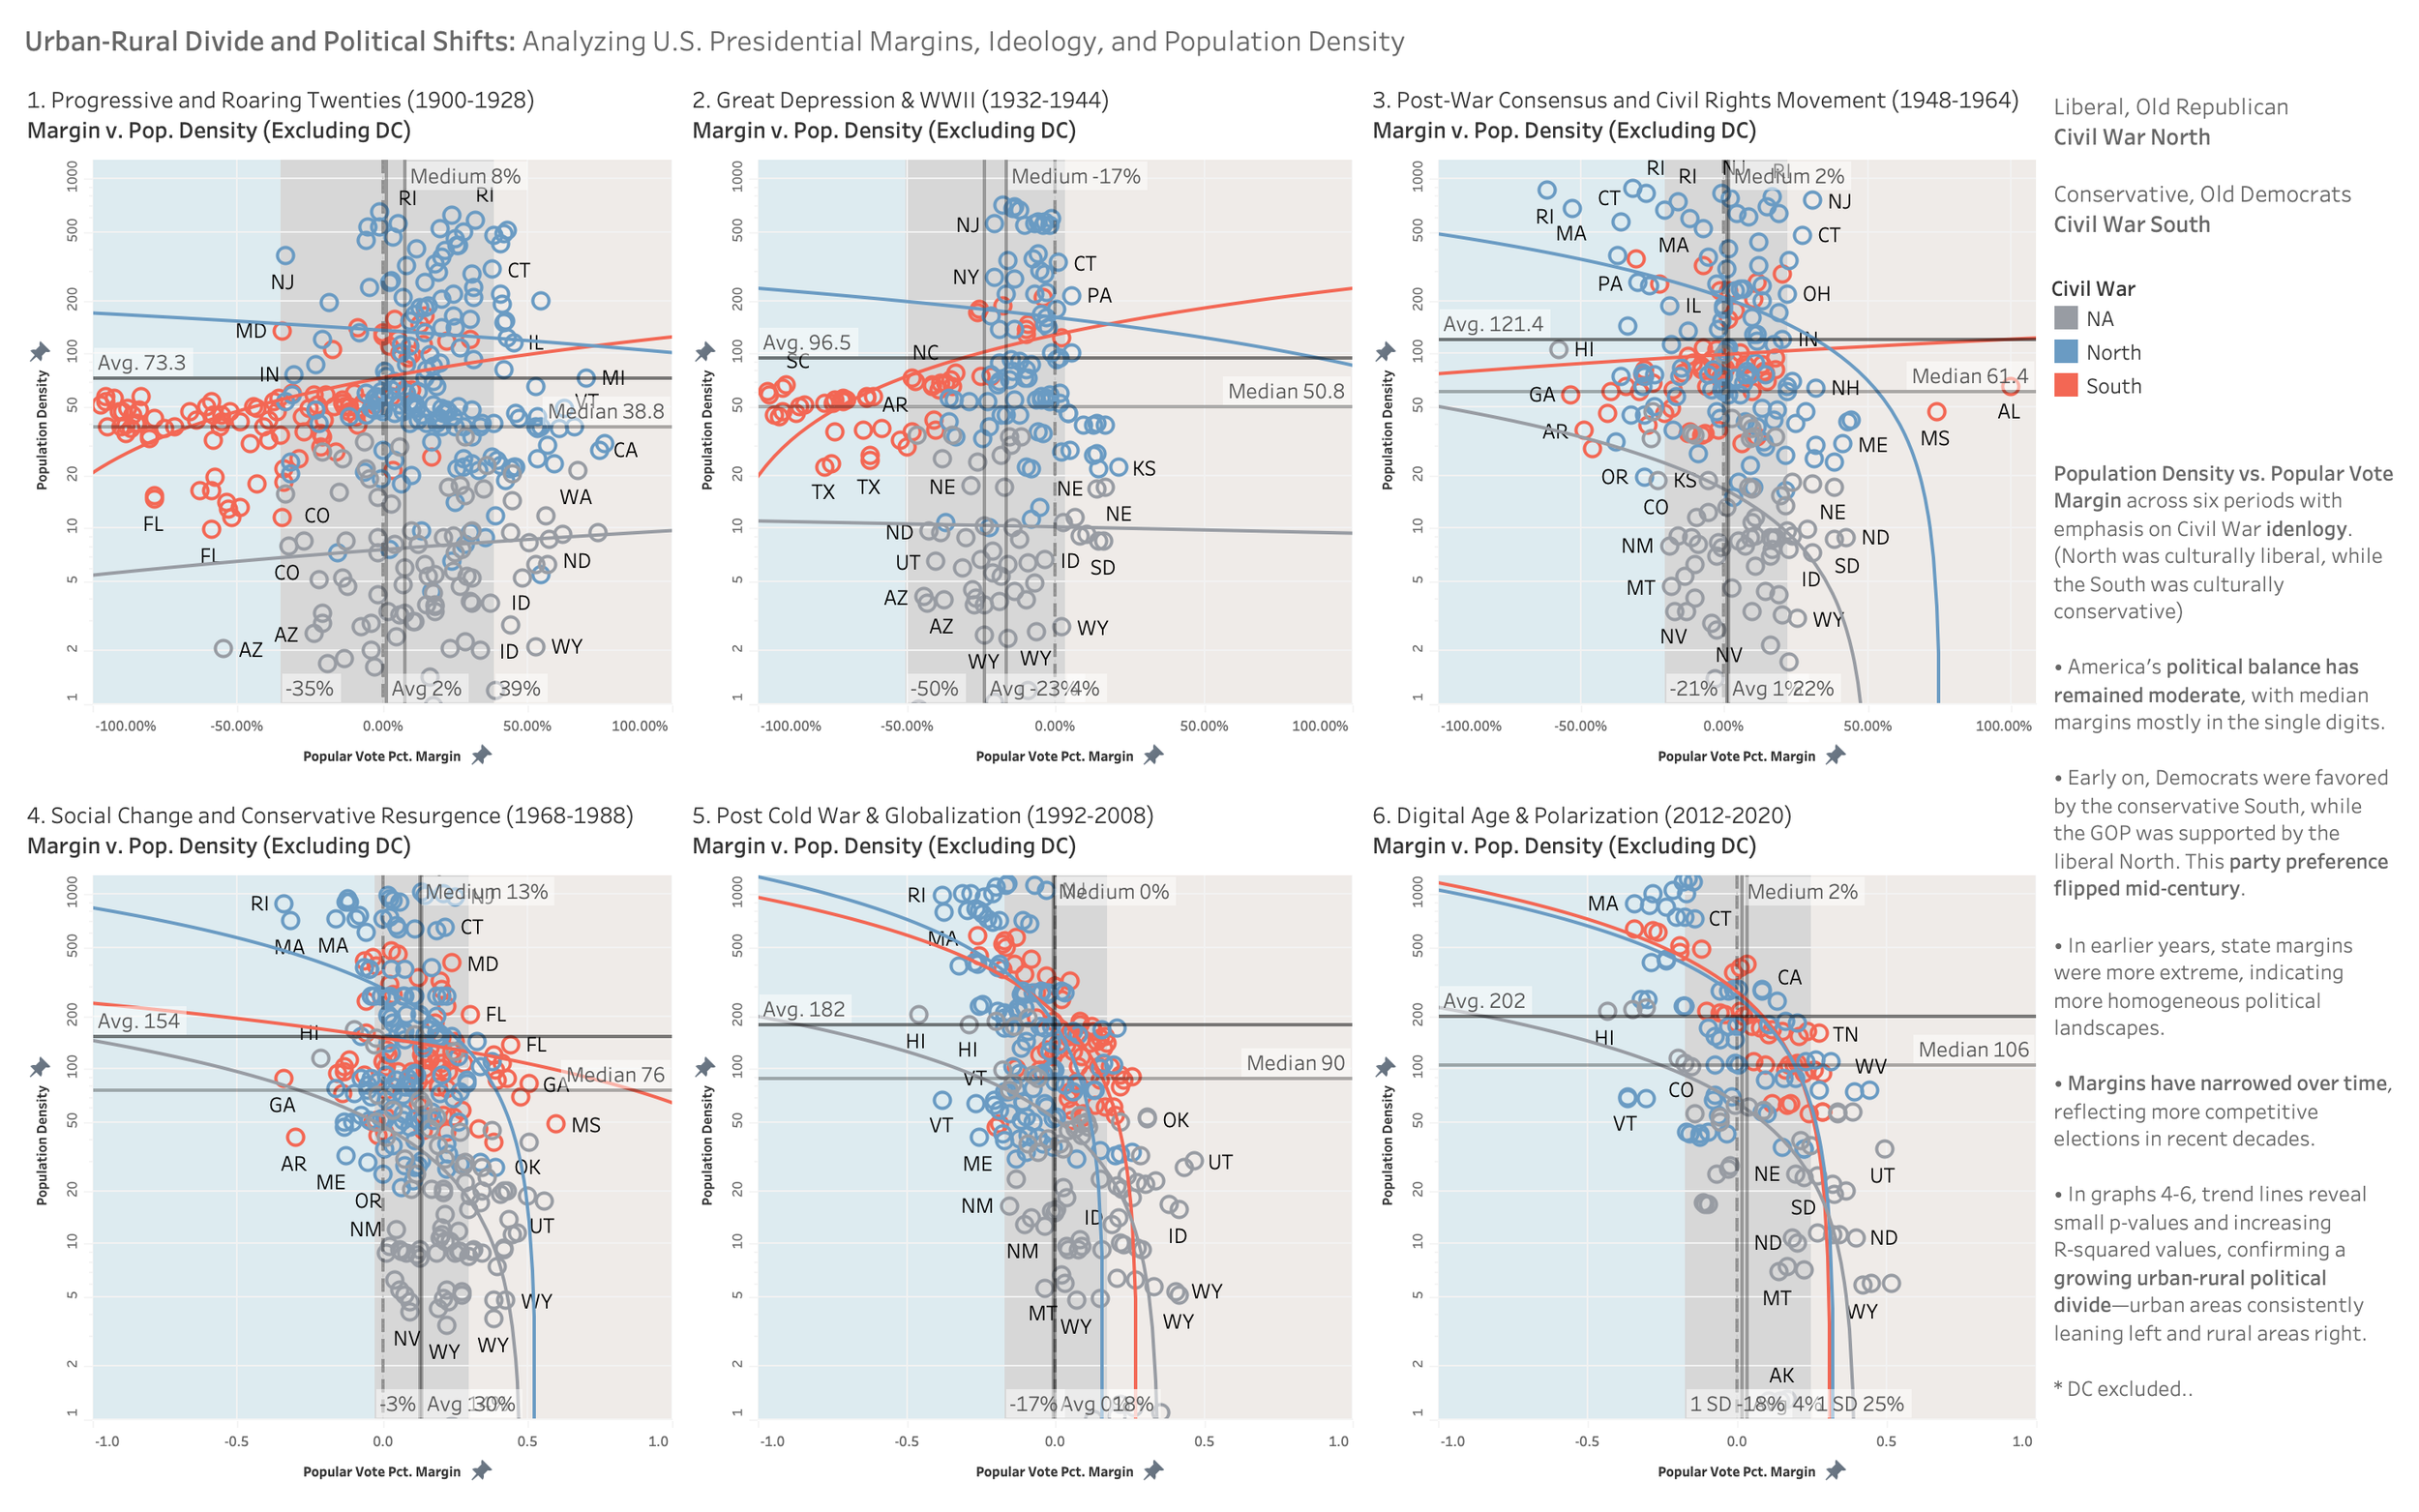
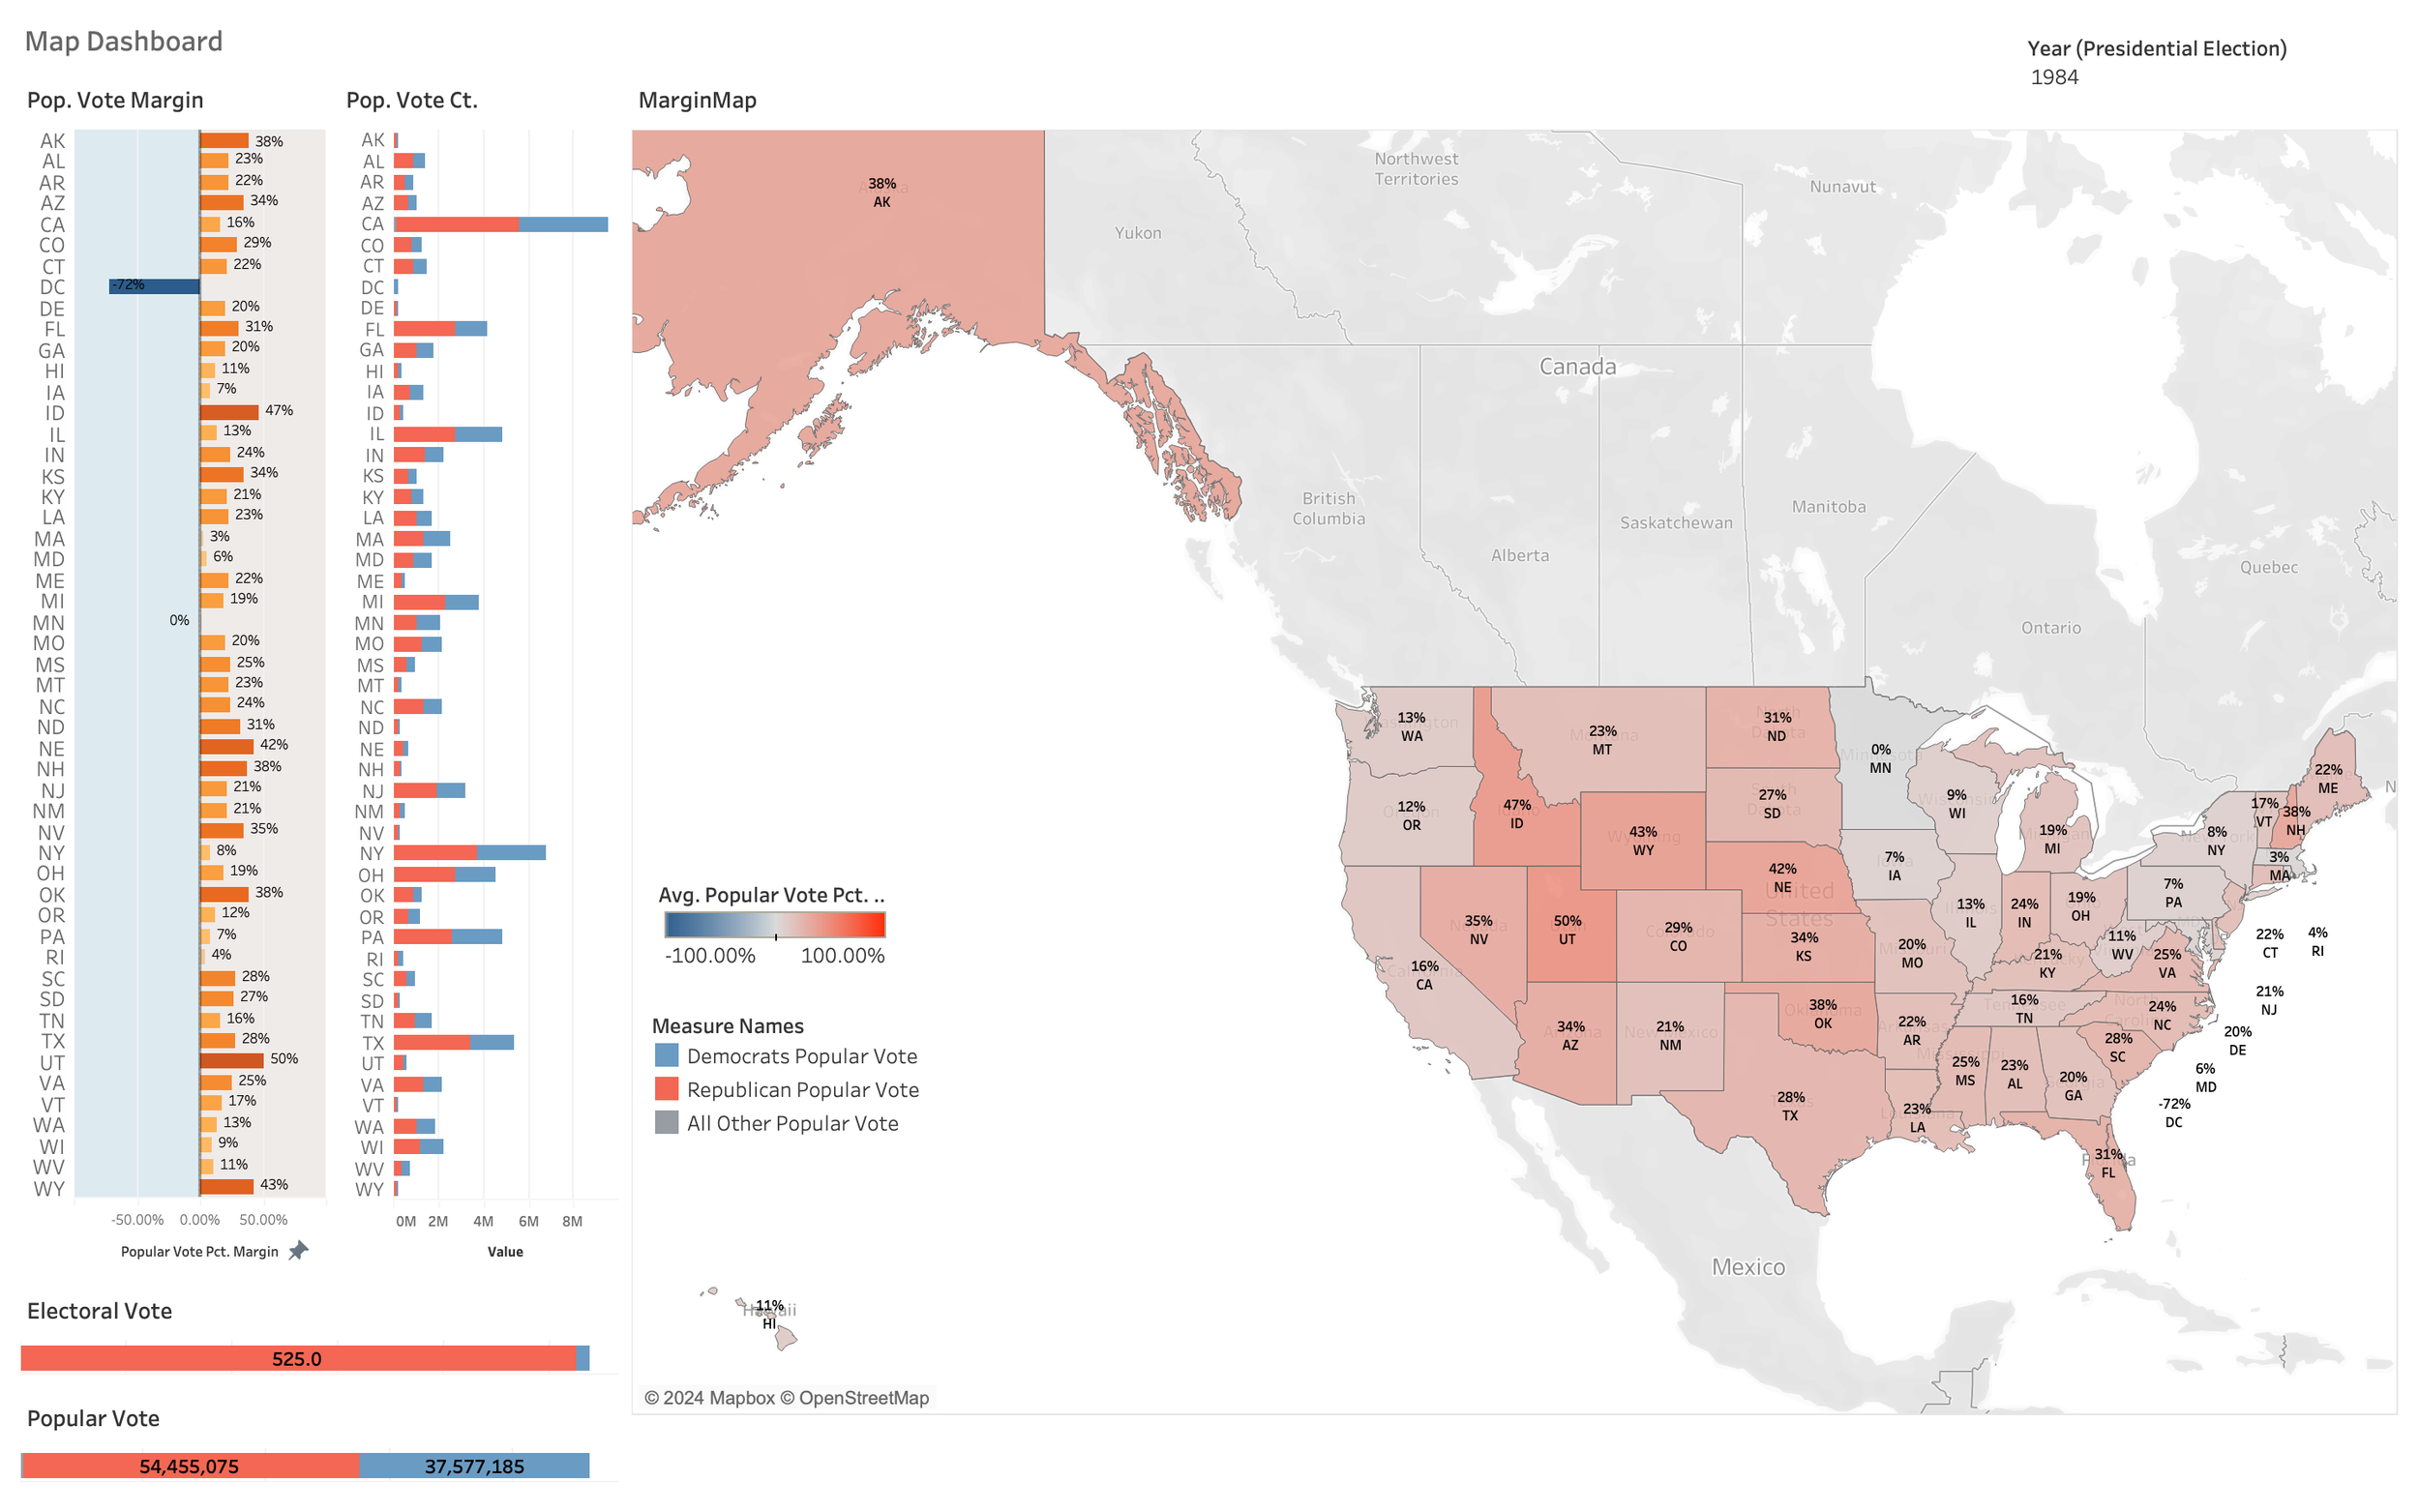
This data exploration project, powered by Tableau Desktop, analyzes U.S. presidential elections from 1900 to 2020. By integrating presidential data from the FEC with demographic and location data, the study delves into the cultural and political shifts across regions, communities, and within the two major parties. The analysis aims to uncover the key factors that have influenced popular vote margins over the past 120 years, offering insights into the evolving dynamics of American elections.
iRecycle
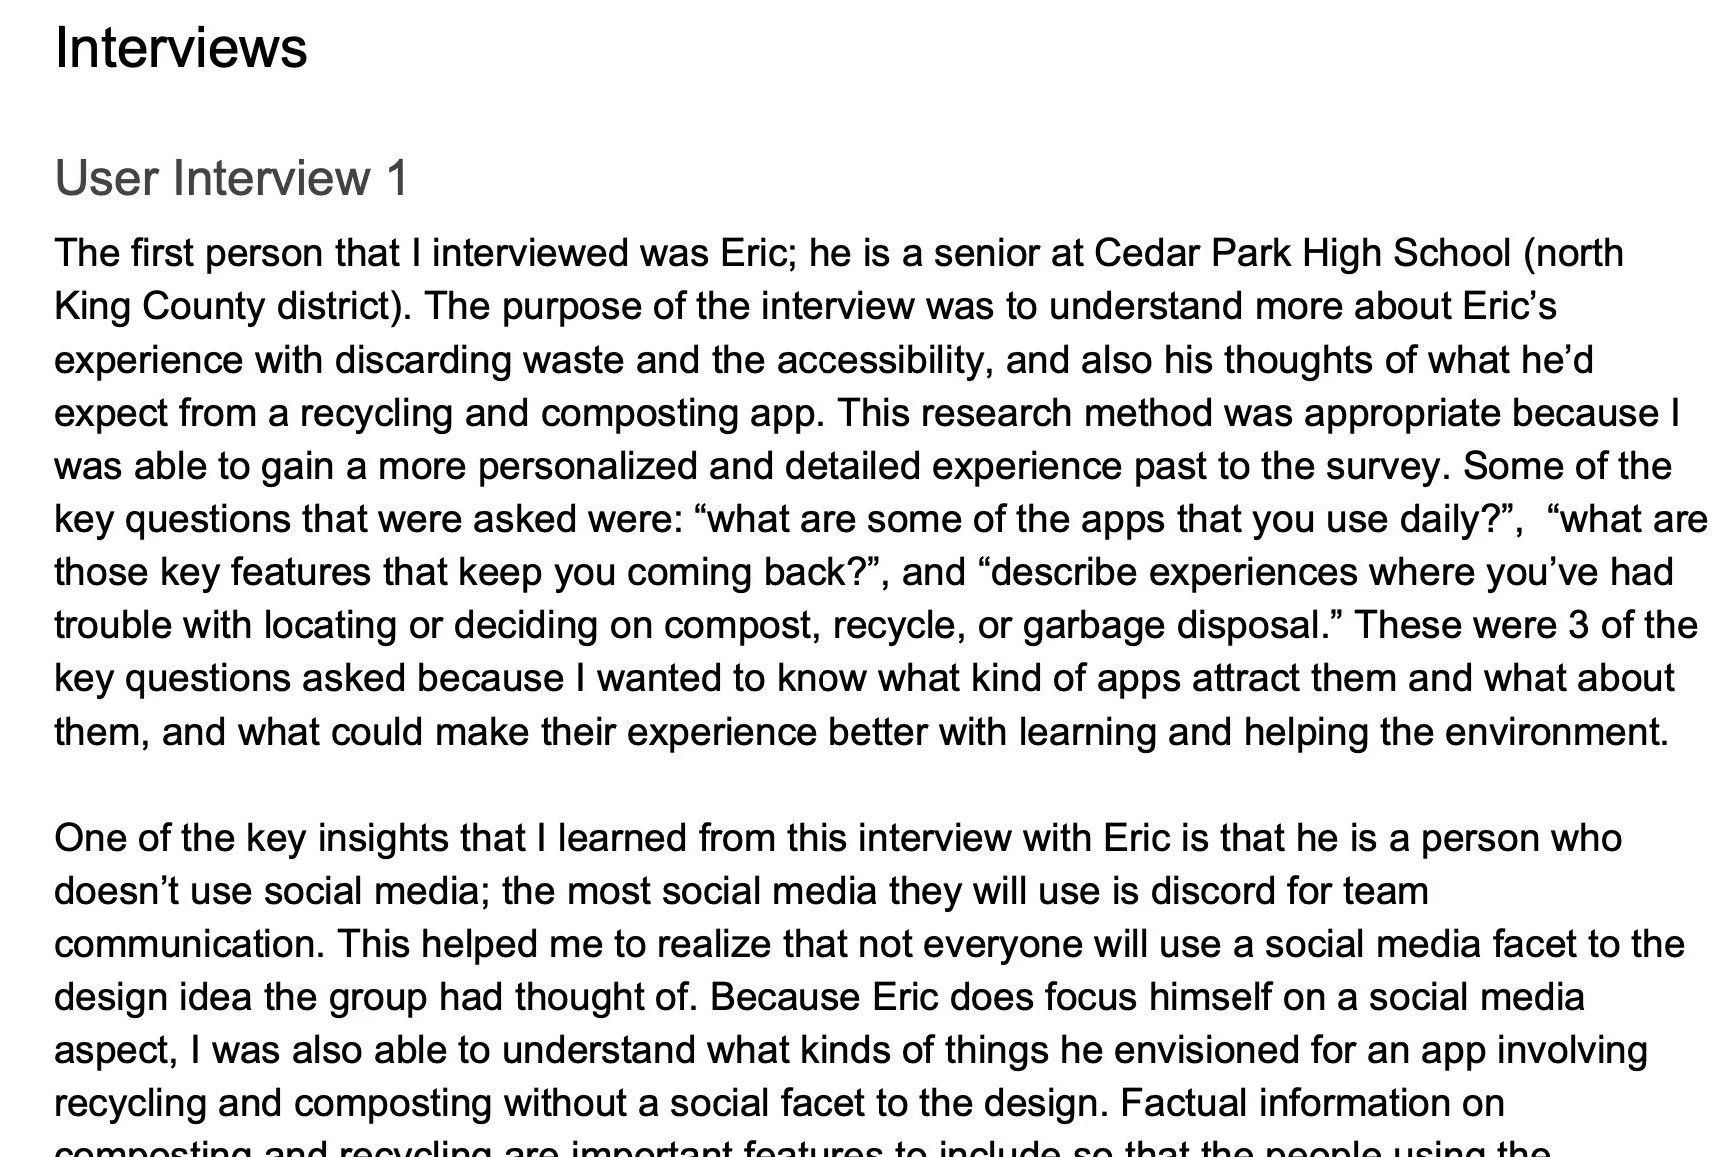
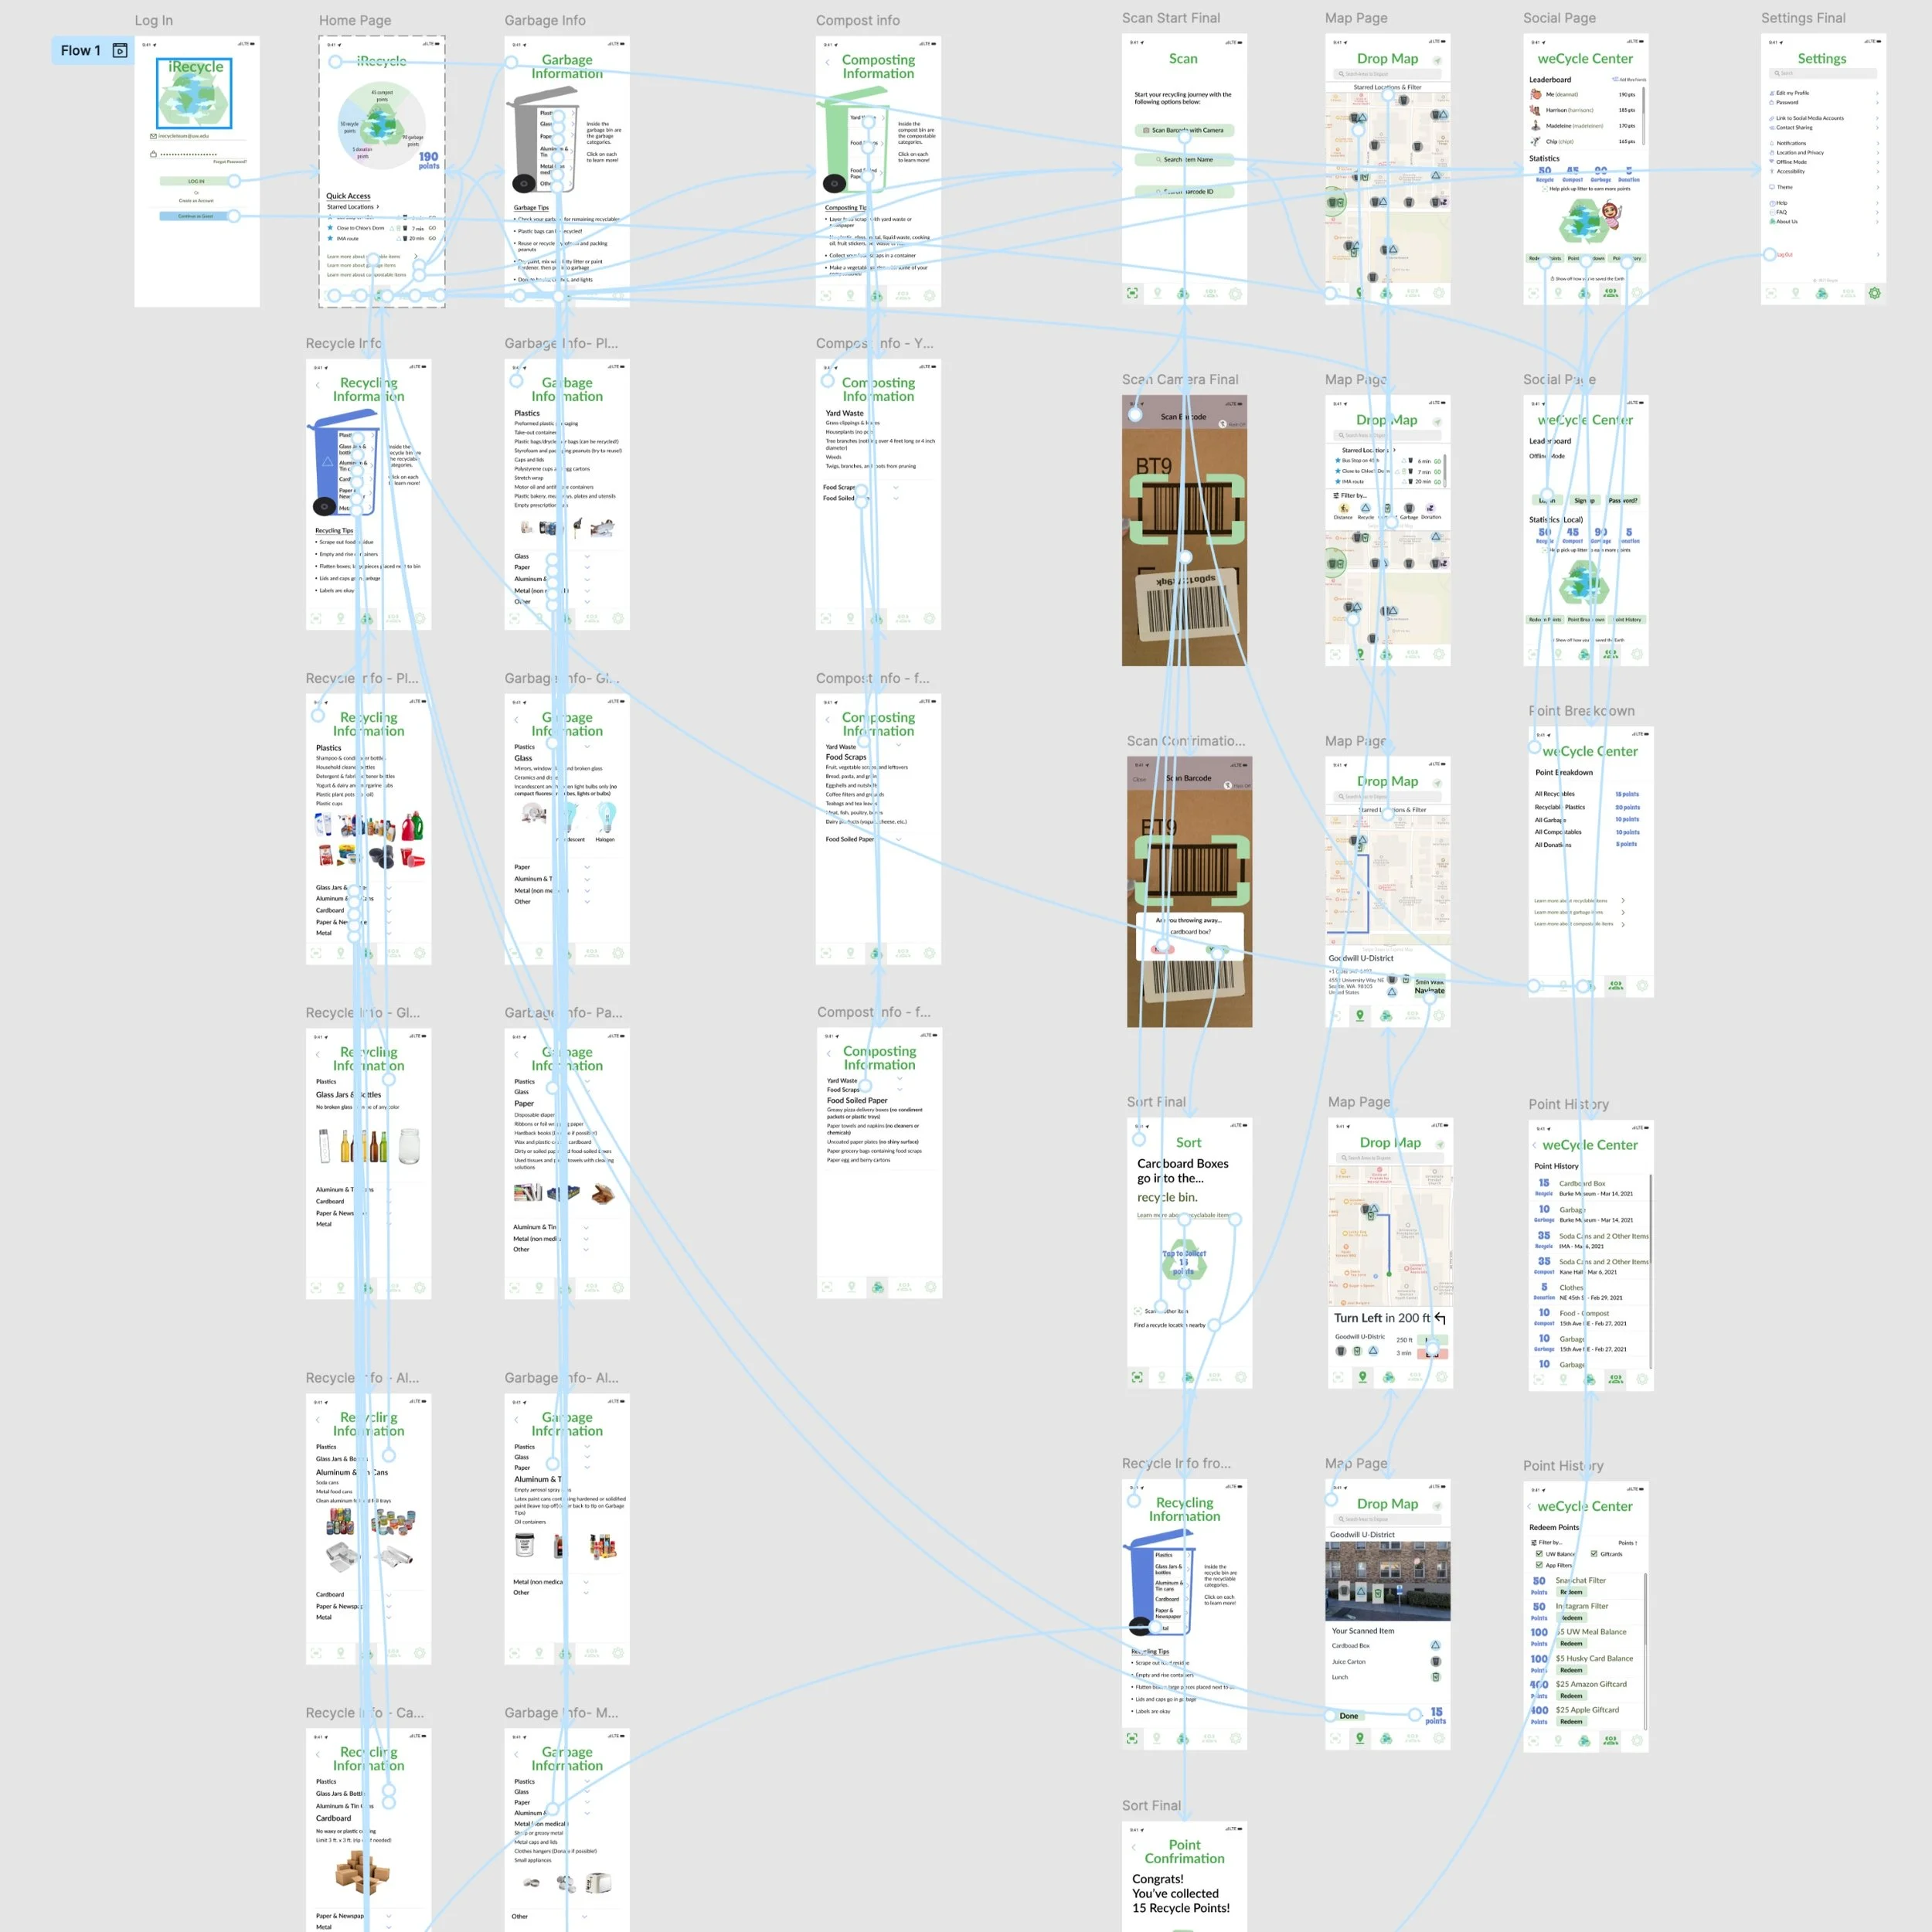
This class project aimed to develop a solution that makes recycling easier and more enjoyable. The project began with user research interviews and stakeholder analysis, eventually progressing into the creation of a fully interactive wireframe. By incorporating insights into human behavior and preferences, we successfully gamified the recycling process, making environmental protection both easy and accessible. The project was honored with the “Best Mini Capstone Project Award” in the class cohort.
User & Solution Research
Quantitative Interview
Qualitative Interview
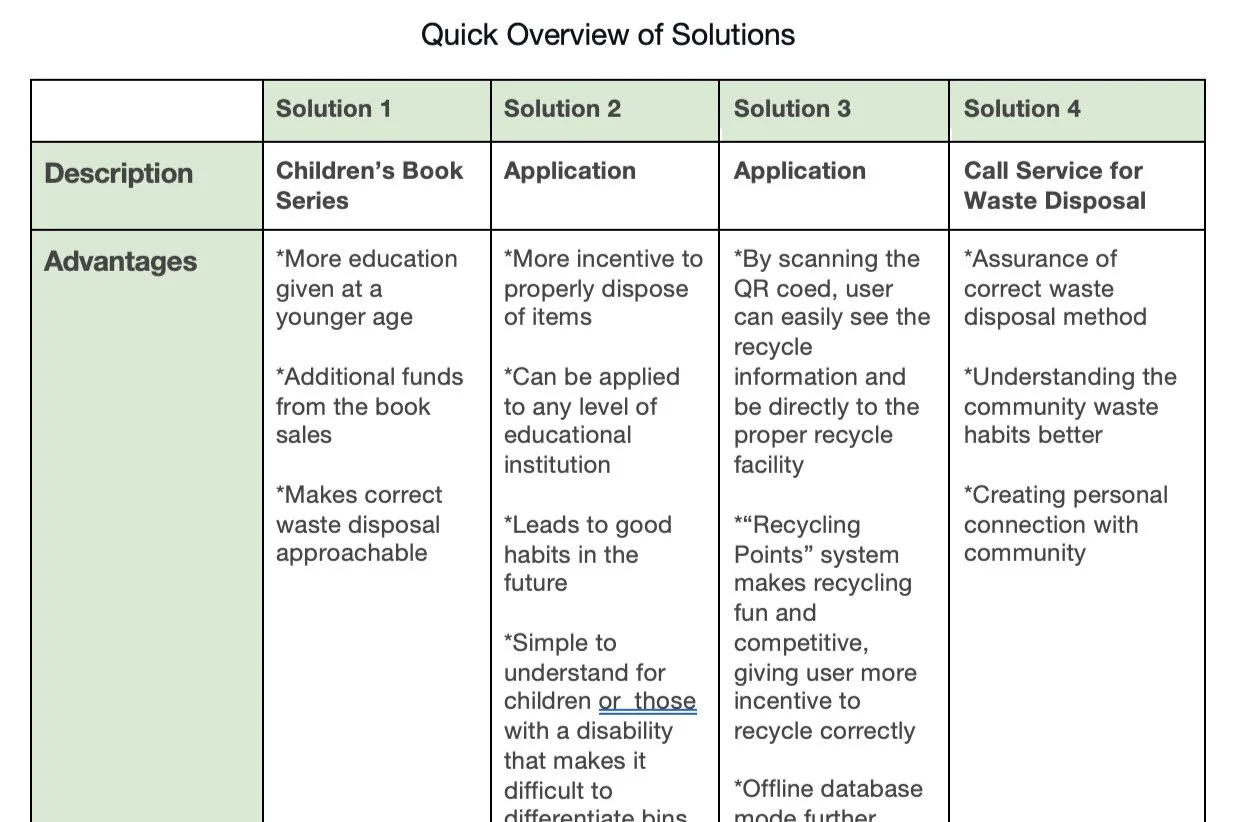
Solution Overview
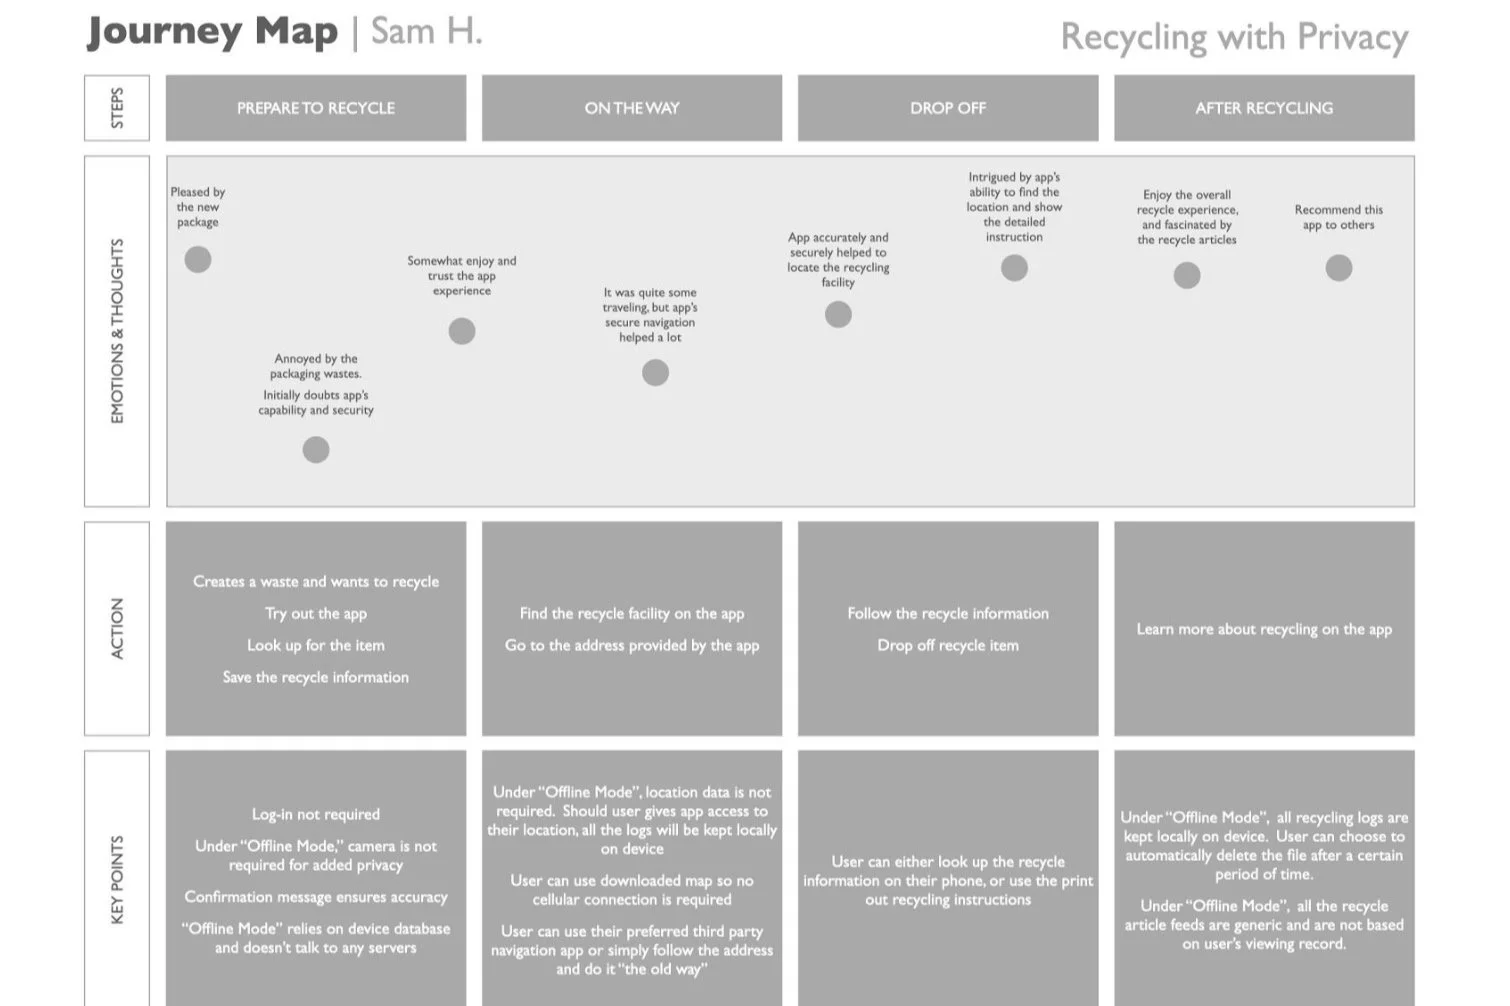
User Journey
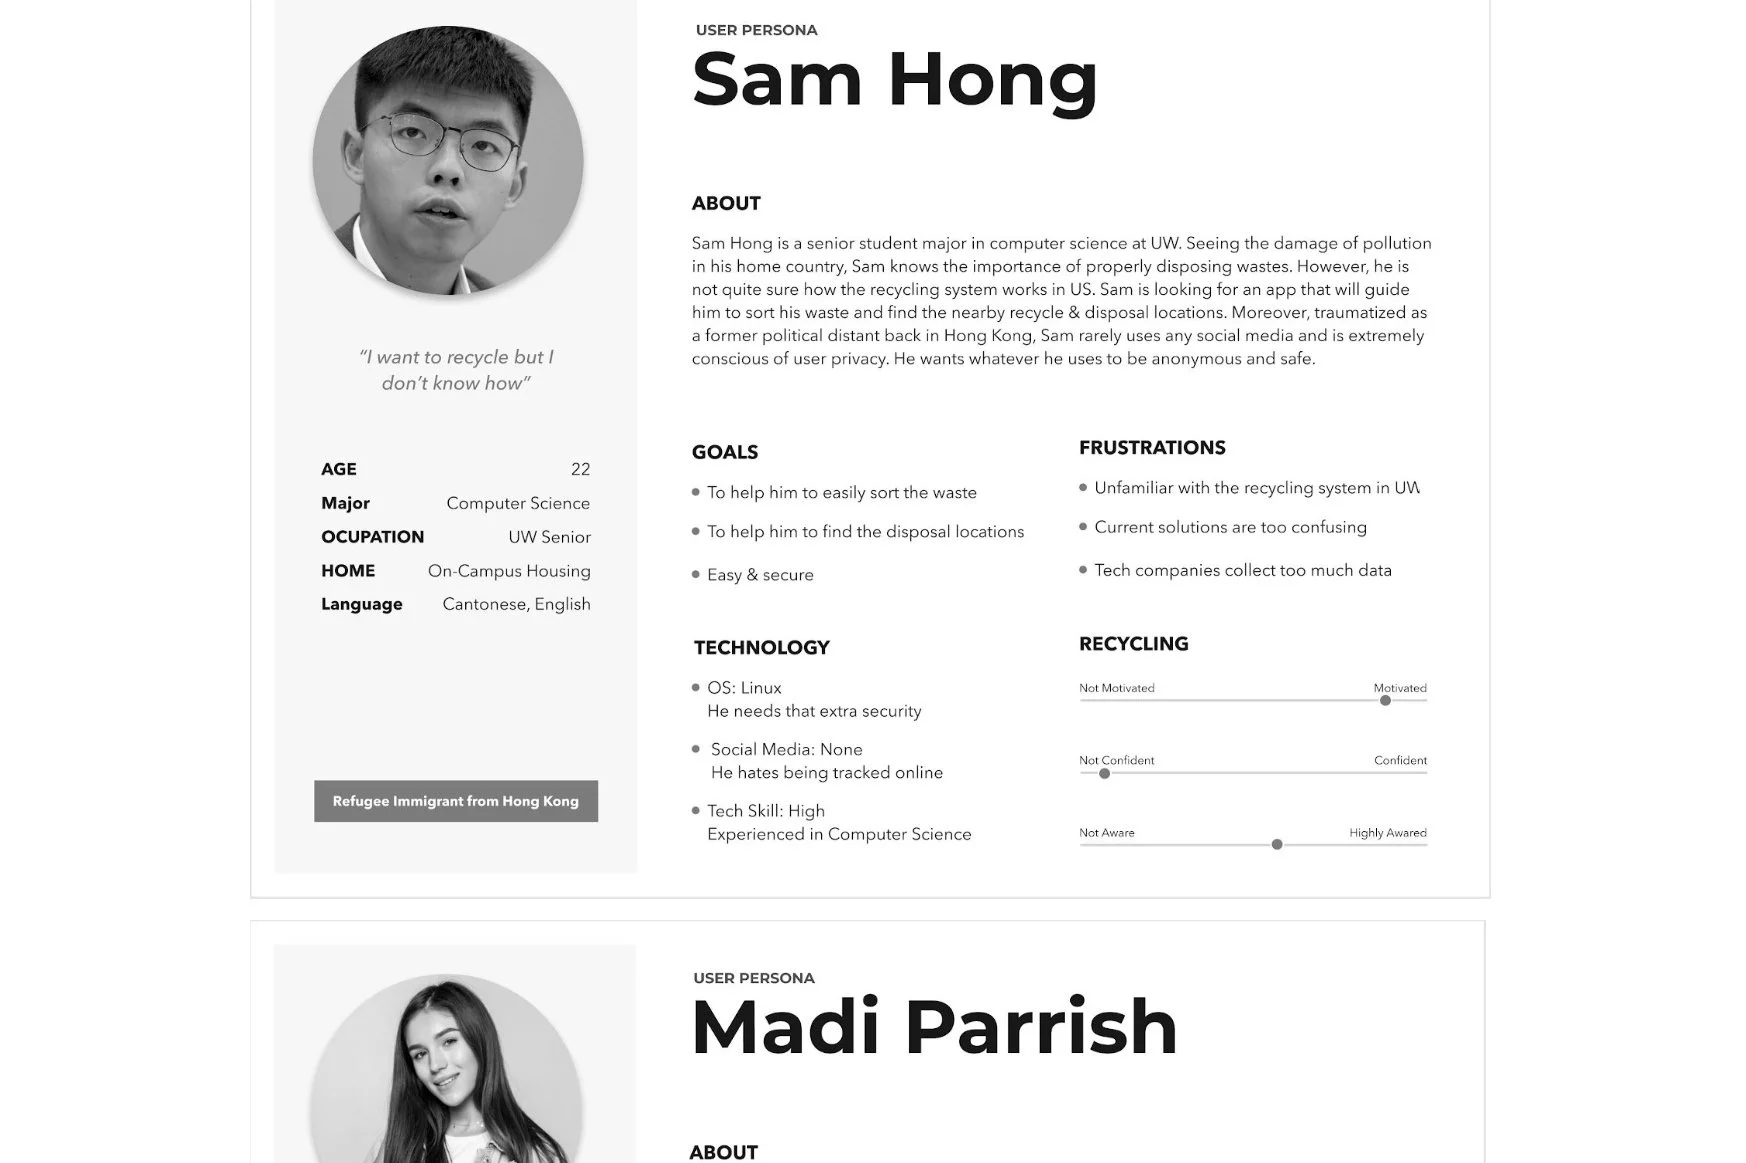
User Persona
User Journey Map for used testing
Solution Design
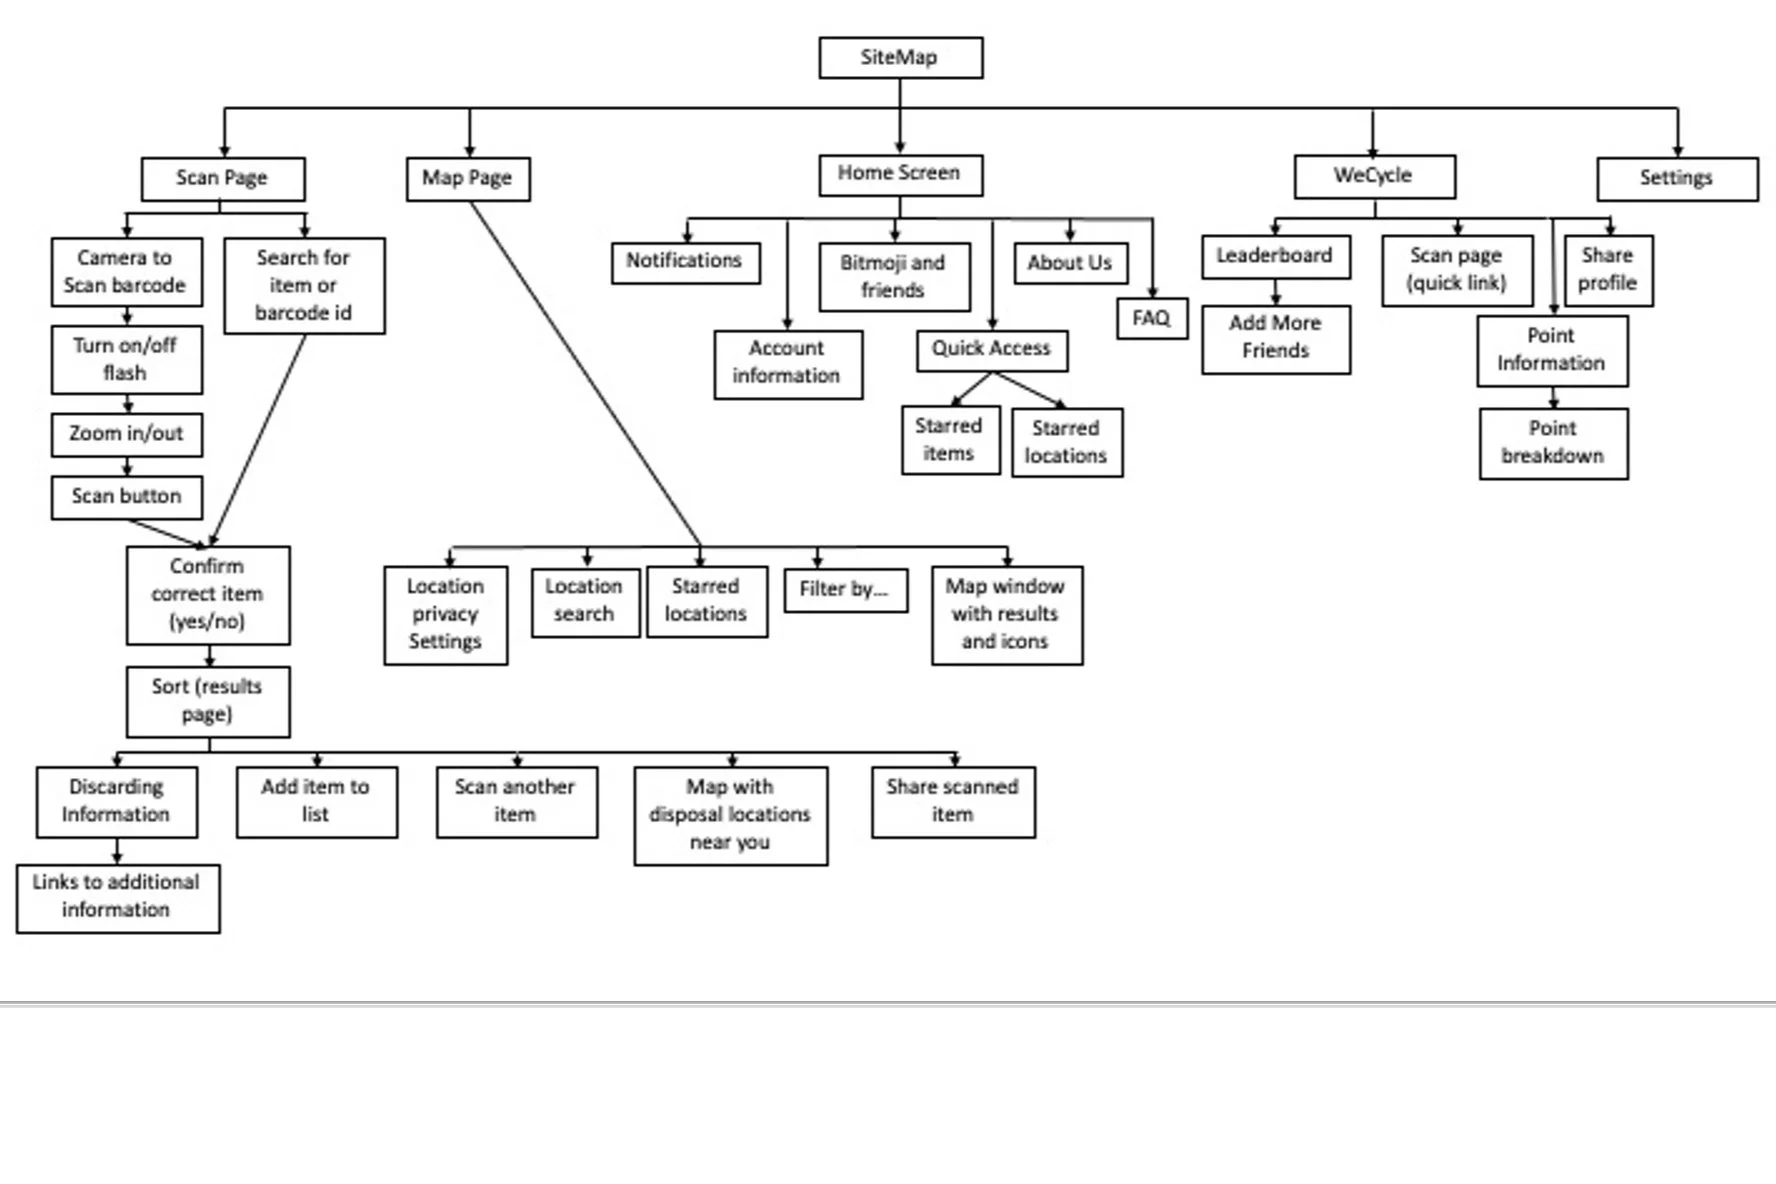
Information Hierarchy & App Topology
Initial Solution Design
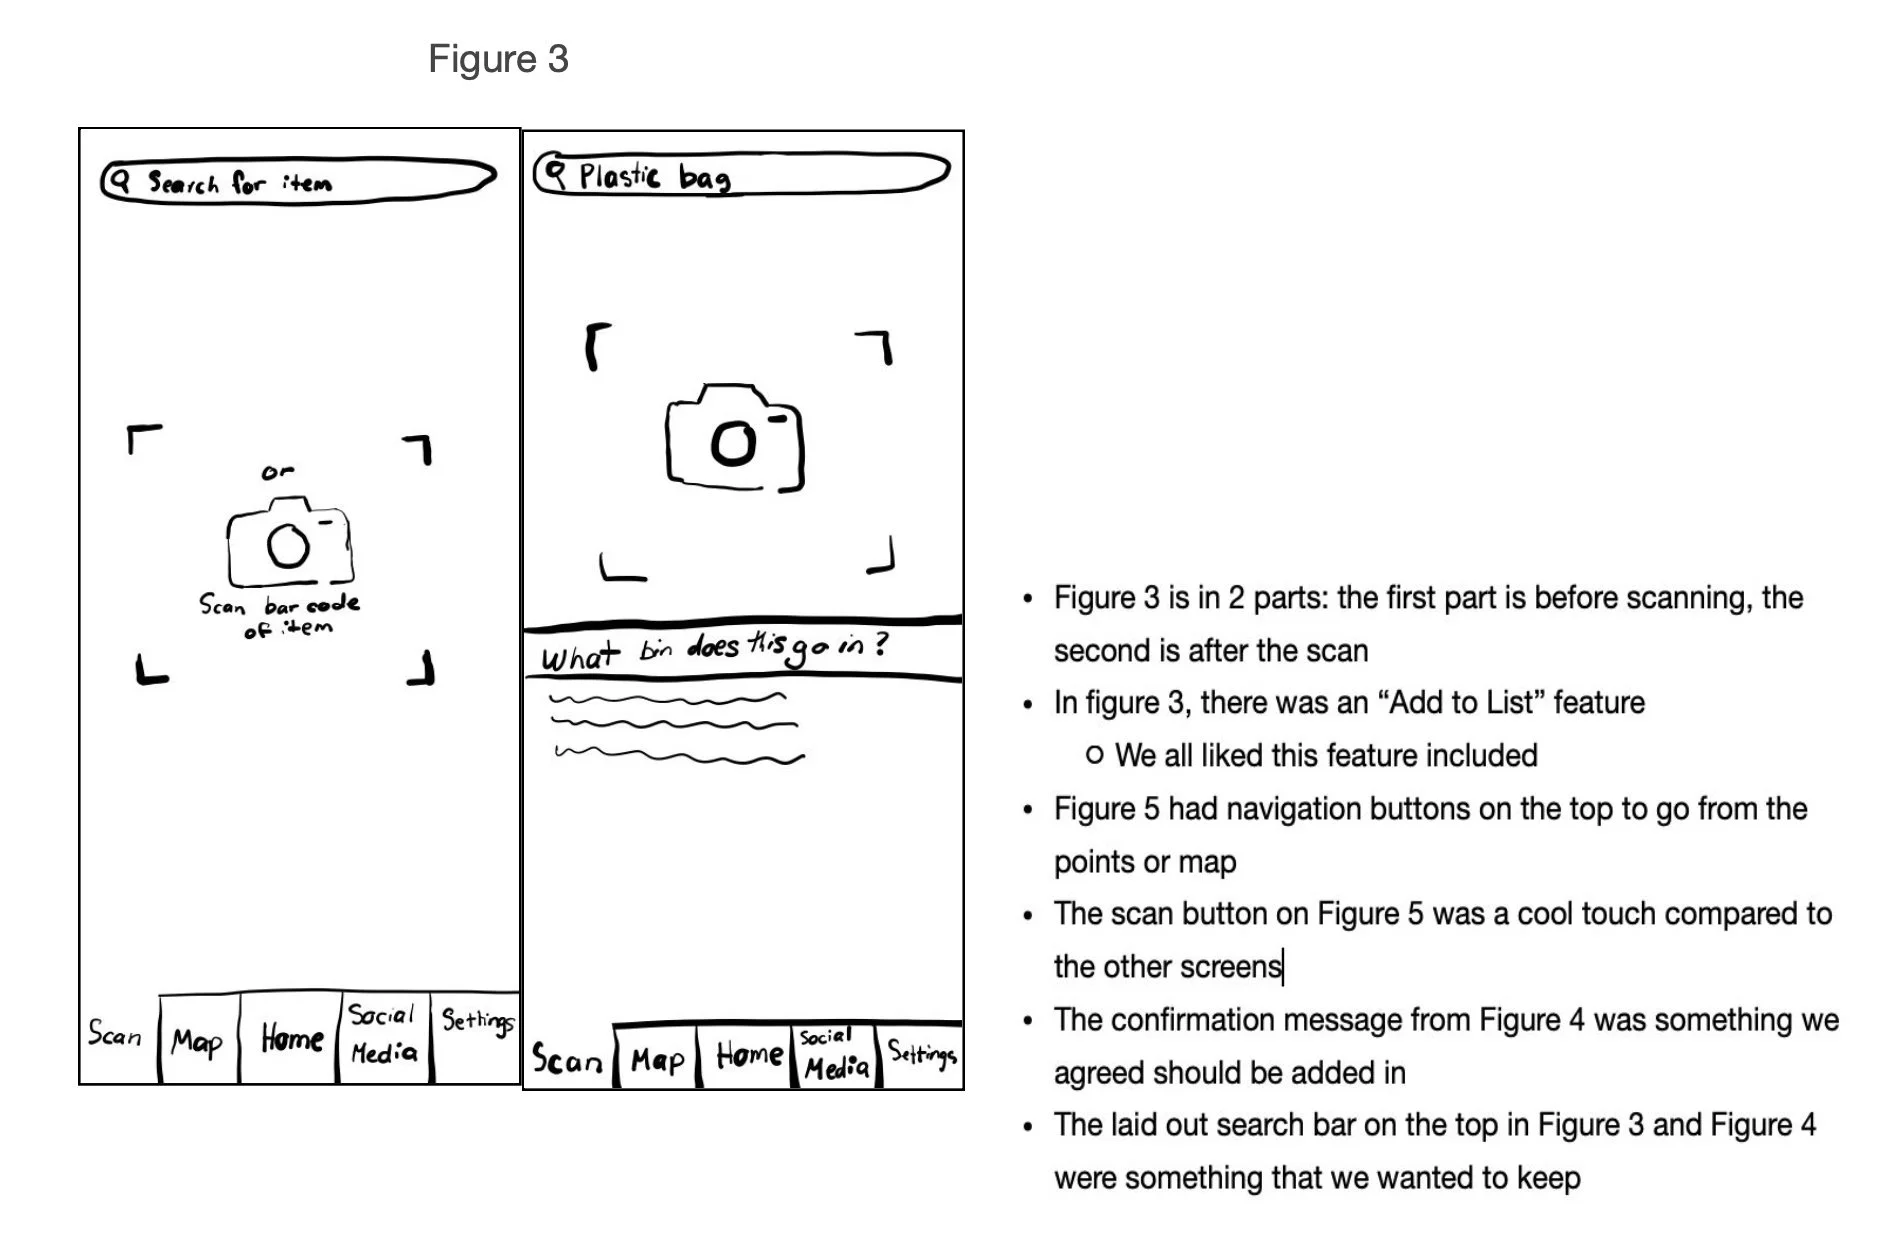
Low Fidelity Design
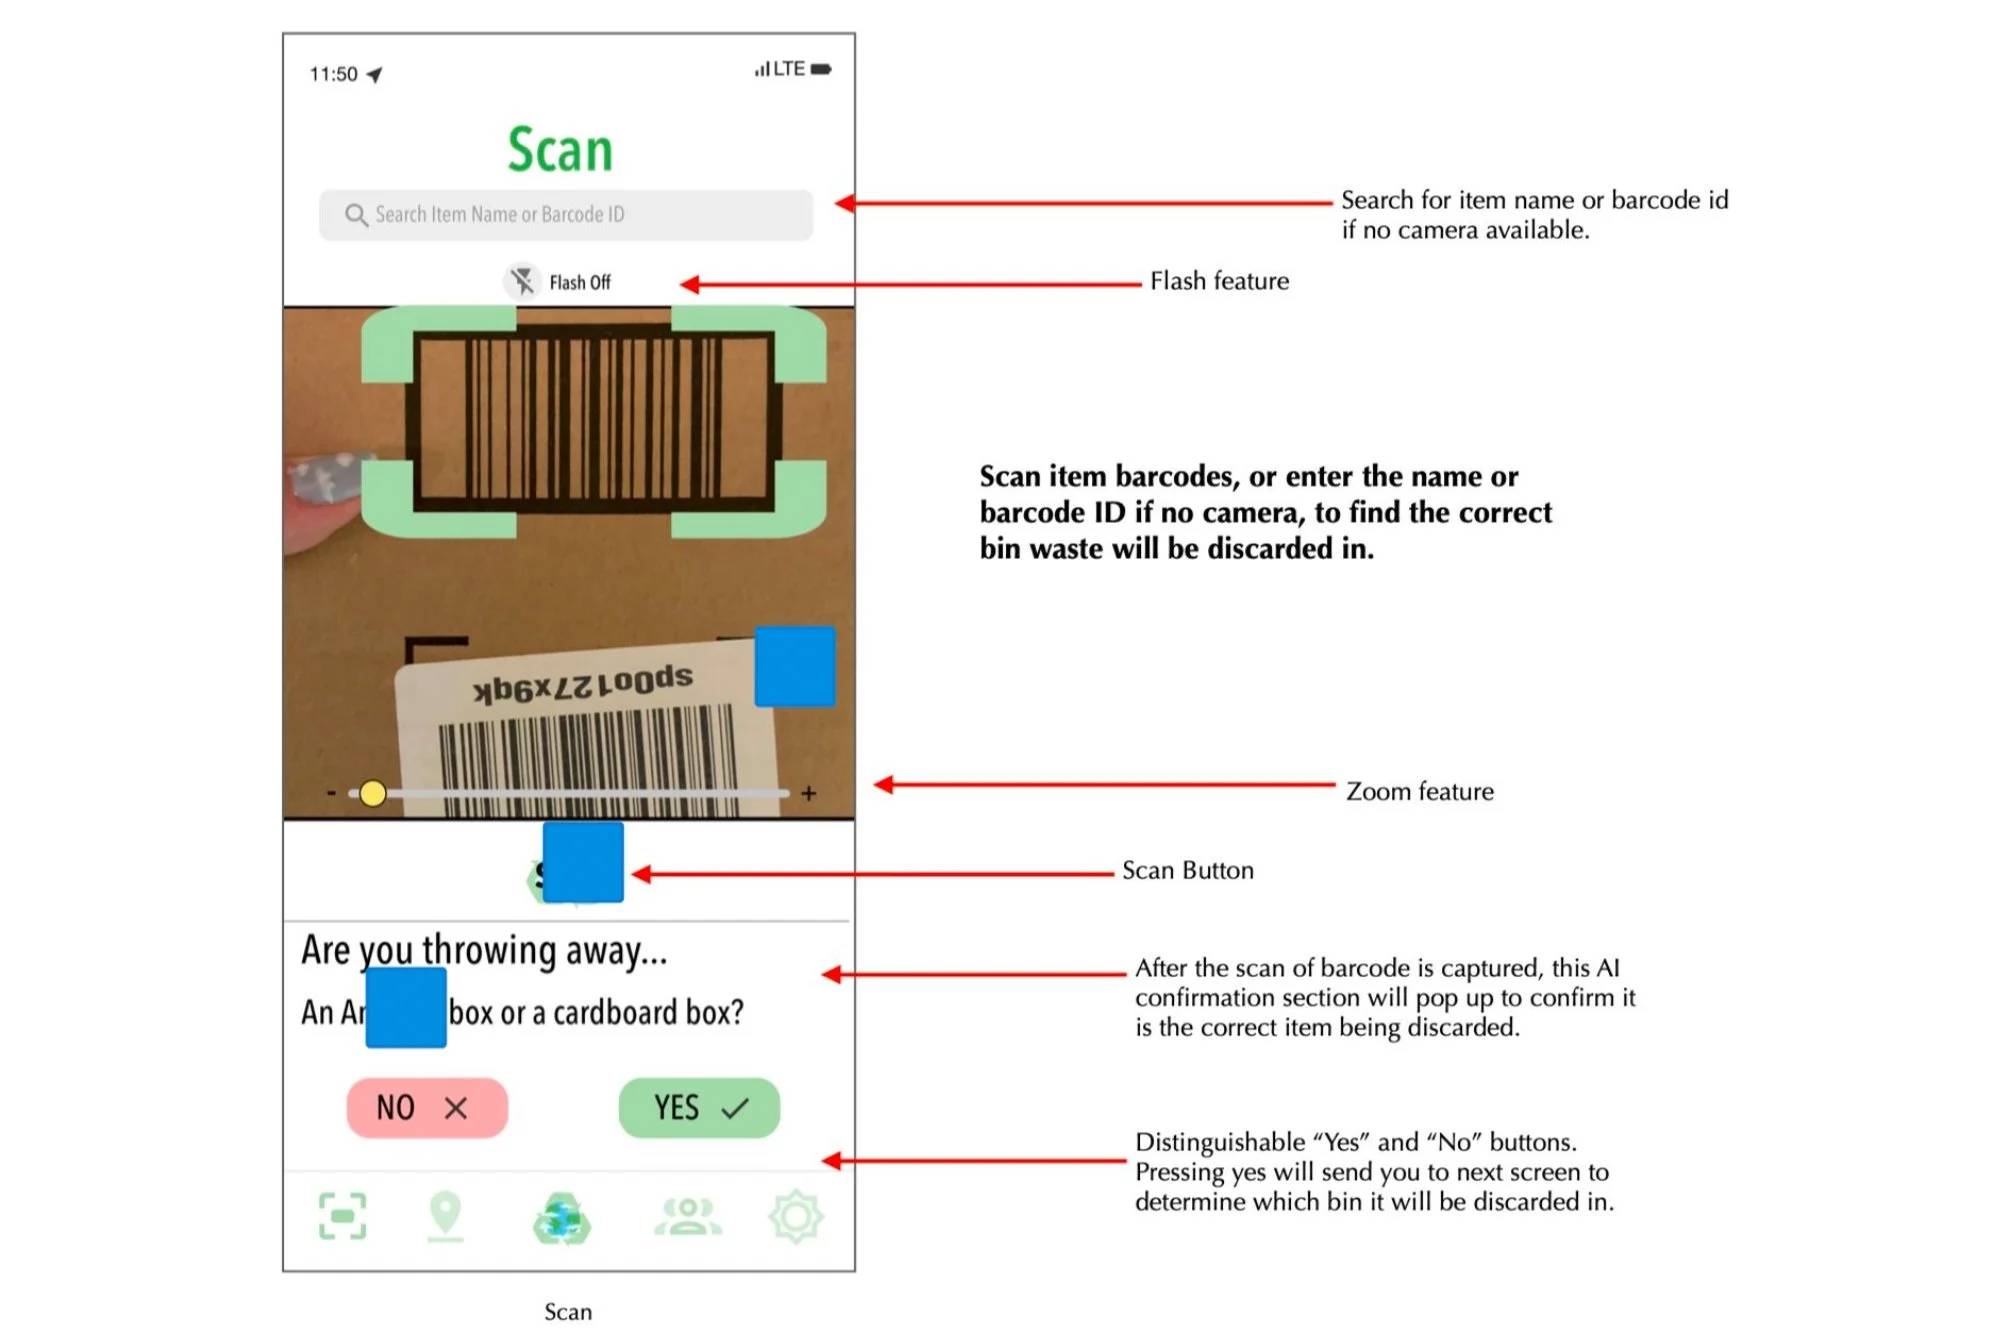
Final Solution
Robotics - “Mission Control” Data Pipeline
Data Collection Interface
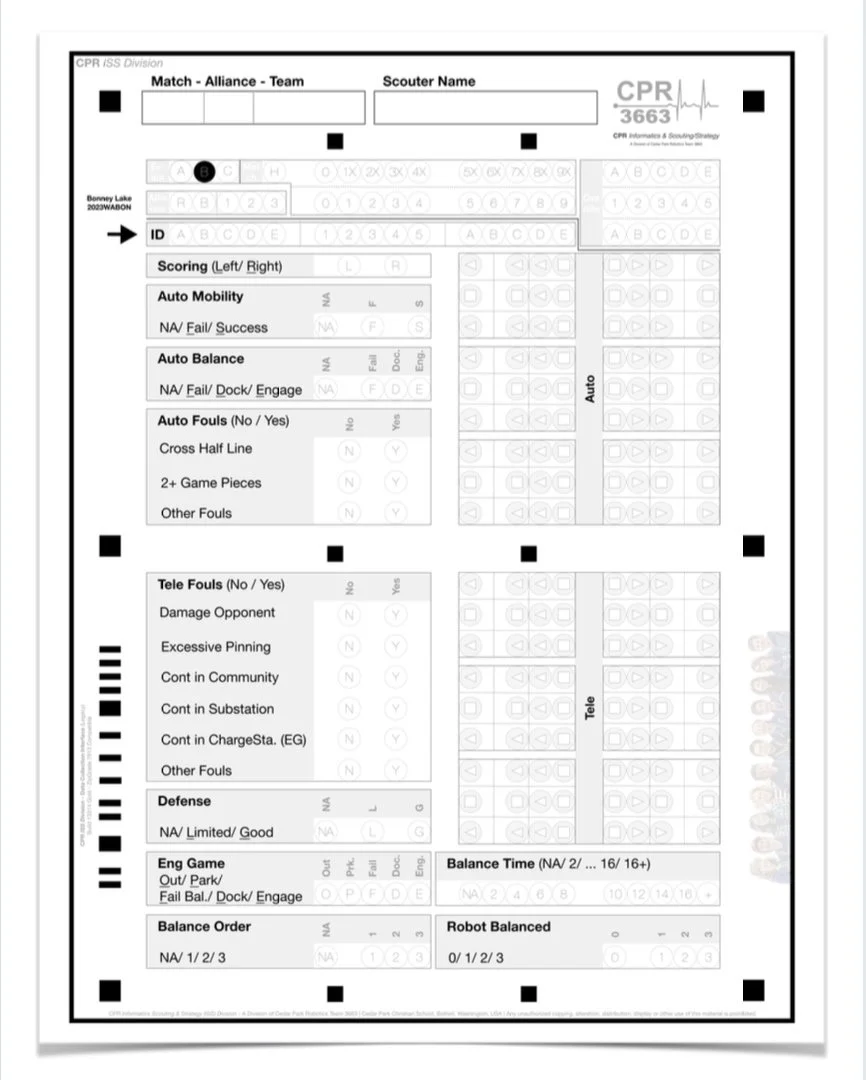
Data collection and analytics are essential for forming effective robotics match strategies. During competitions, each match lasts only two and a half minutes, requiring scouters to collect dozens of robot metrics in real time. This creates a significant challenge in designing a data collection interface that ensures accuracy through an intuitive layout and thoughtful affordances.
Under my leadership, we experimented with a scantron-like system and a mobile app approach. Both underwent extensive user testing and validation to ensure they required minimal training, reduced potential entry errors, and were intuitive to use. Additionally, all systems were rigorously tested to perform reliably in environments with unstable network connectivity.
By the end of my tenure in robotics during the 2023 season, both legacy analog and digital data collection solutions had proven their reliability. These systems were not only praised by our scouters but also adopted by several other teams in the PNW district, demonstrating their impact and effectiveness.
For more information, visit Robotics & Scouting page and reference ISS Documentation, DCI Design sections.
“Mission Control” database
Data integrity is equally crucial to the success of strategy operations. Once data is collected, it is processed using Excel scripts (prior to 2021) or R scripts. The data undergoes logical checks and is compared against key metrics obtained from the official API. When discrepancies are detected, the data is either corrected or manually overridden. This rigorous validation process ensures a high accuracy rate of 99%+ for our analysts, enabling reliable and effective decision-making.
For more information, visit Robotics & Scouting page and reference ISS Documentation, Mission Control Design.
Data Visualization and Analysis
Tableau Desktop creates comprehensive, easy-to-understand data visualizations. These graphs and dashboards are not only powerful but also highly customizable and interactive. They are used for match strategy planning, alliance lobbying, as well as data outreach.
For more information, visit Robotics & Scouting page and reference ISS Documentation, Tableau & Data Visualization.

